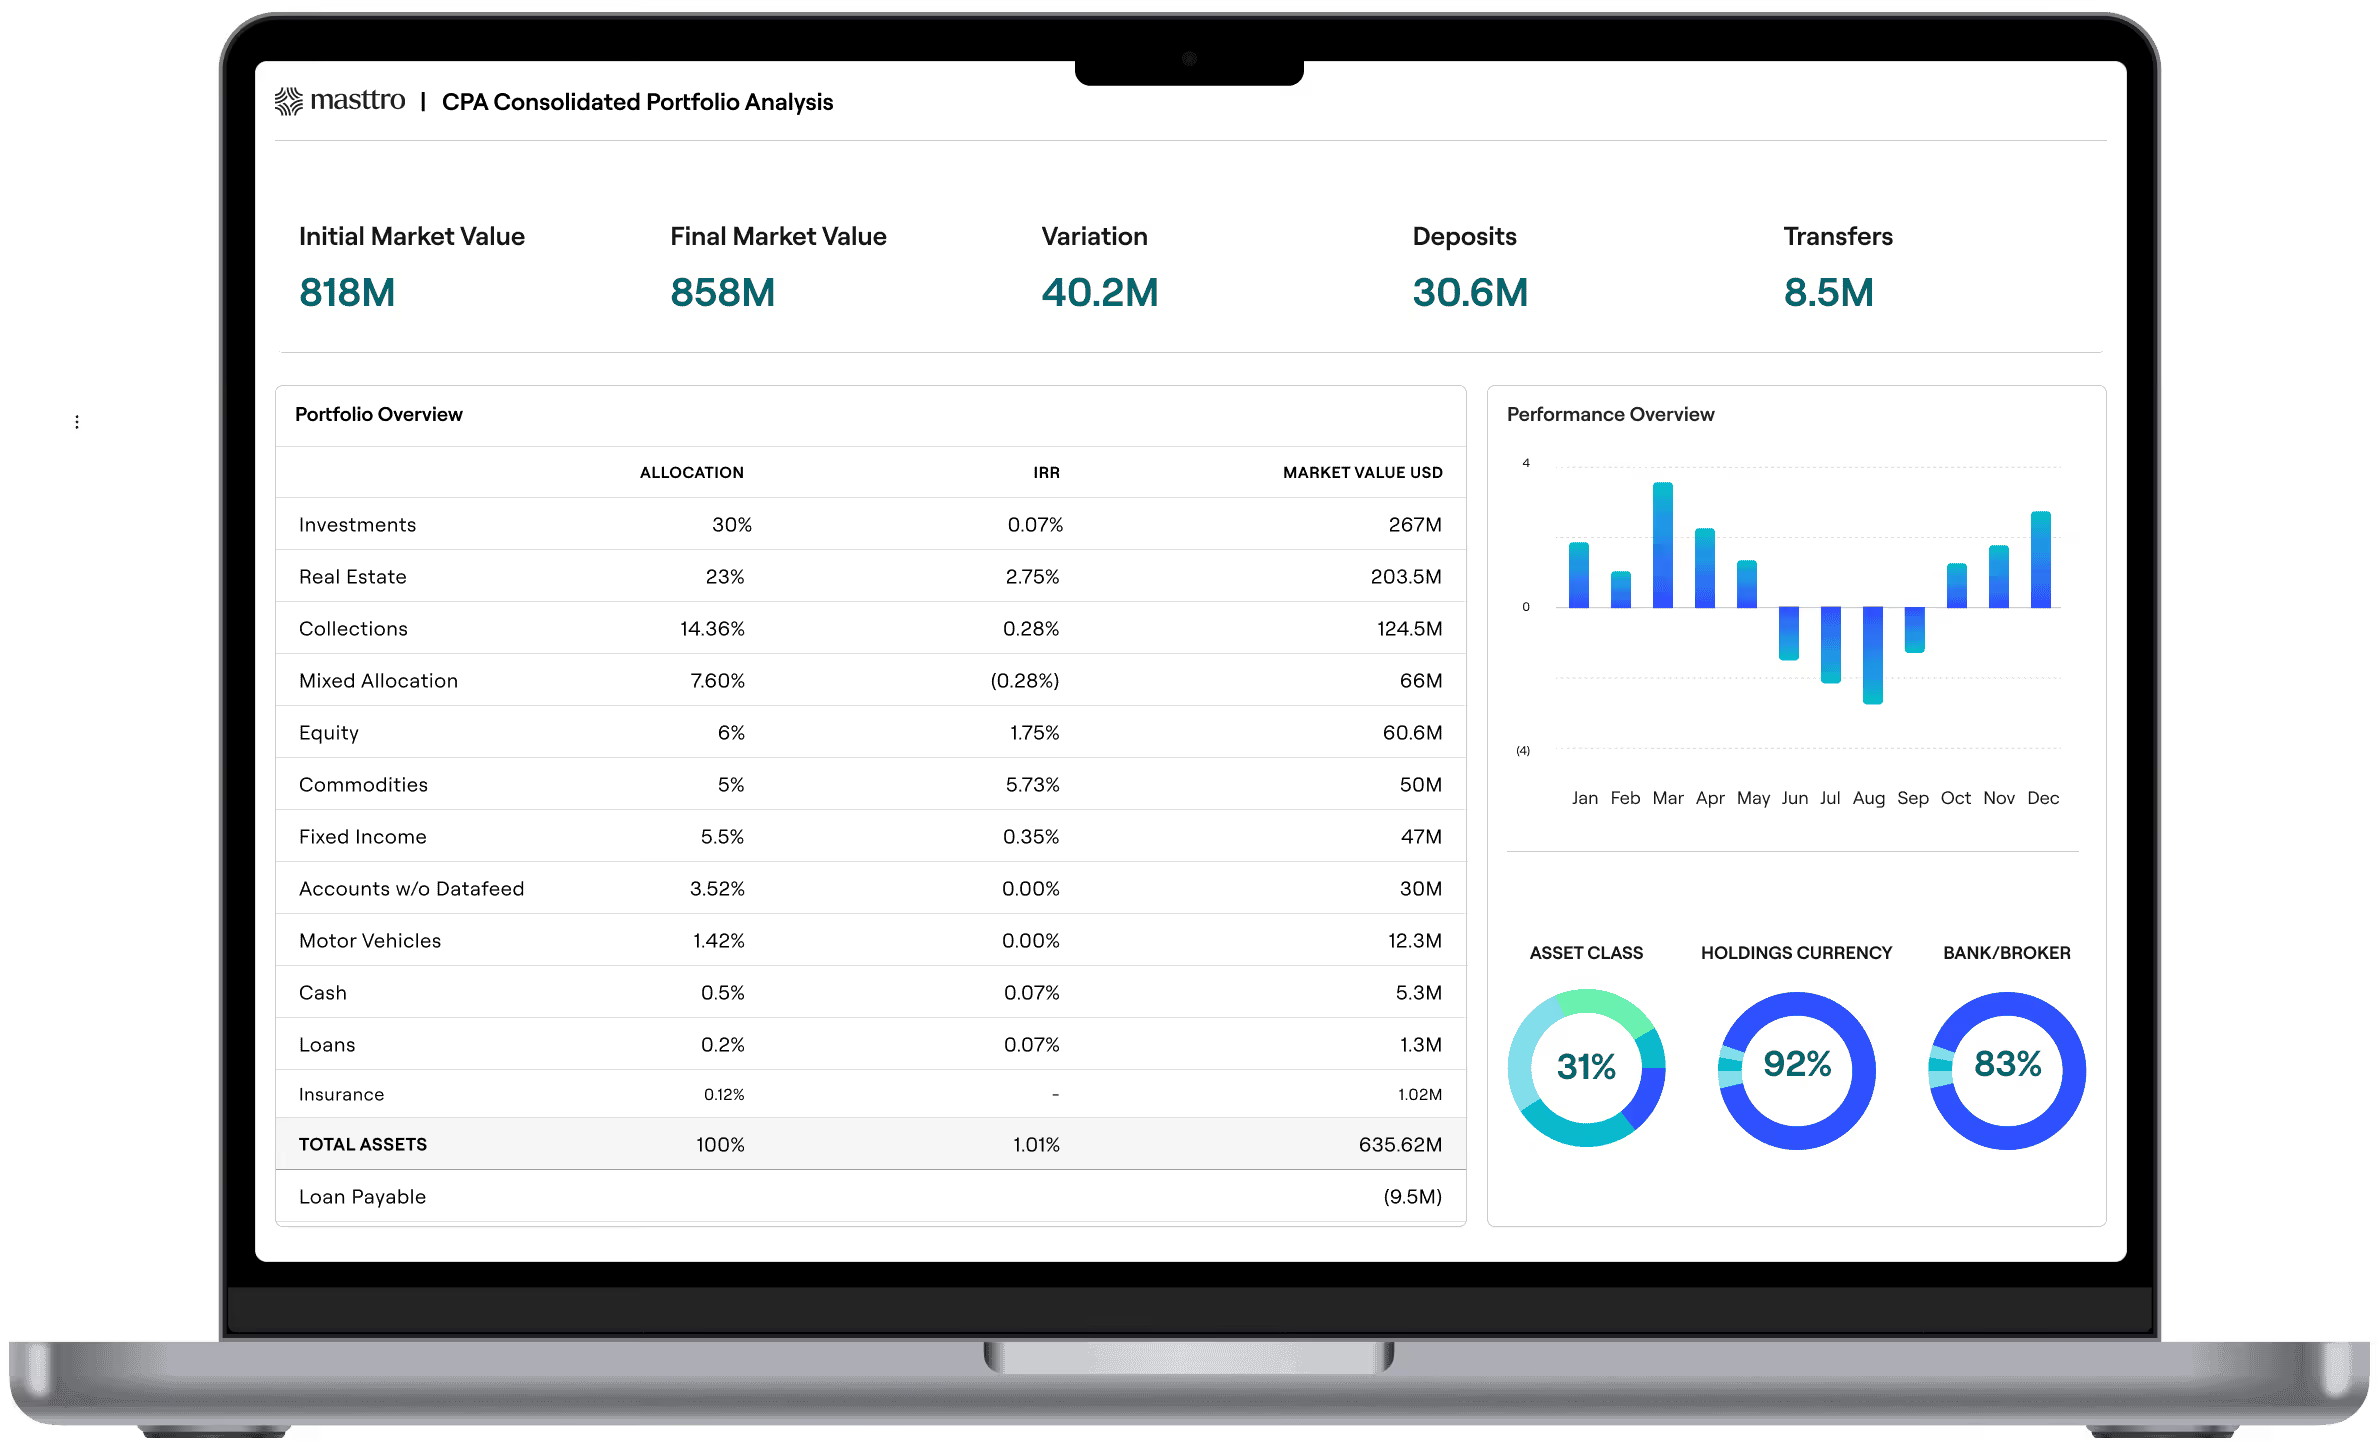

Key Takeaways

What is a family office dashboard?
A family office dashboard is a structured set of customizable views presenting consistent performance metrics across custodians, legal entities, currencies, asset classes and stakeholders. It exists to answer recurring questions without rebuilding the answer each time. A family office dashboard should give you immediate answers to what we own, how it is performing, what is due, and what changed since last quarter.
There are distinctions that matter between a dashboard, a report and a portal.
- A dashboard is interactive and built for frequent use. It supports decision making.
- A report is a packaged output, for example, quarterly reports, a monthly book, a board pack, distributed on a cadence. It supports communication.
- Digital portals are the delivery layer, answering how principals, family members and advisors reach the information securely.
A family office needs all three, drawing on the same aggregated data. When the dashboard and the quarterly pack disagree, the dashboard loses.
Why do family office dashboards fail?
Family office dashboards fail on data, not design. The charts are usually right. The problem is that a principal asks a follow-up question and nobody can answer it from the screen. That is how a dashboard loses the room, and how a wealth owner stops trusting the numbers they are given.
Balance sheets and single-custodian portals were built to show one account at a time. UHNW family wealth does not exist in that way. It sits across trusts, joint ventures, holding companies and foundations, in several currencies, with a third of the value in private investments that report their value once a quarter, if that.
The typical problem is that the dashboard looks finished when it is not. The private holdings are four months out of date, two entities are missing, and the cash figure counts money the family cannot actually reach.
The fix is not a better chart. It is one set of numbers sitting behind every view: every account, every entity, every private holding, reconciled and dated, with a path back to the source. Build with the right tools, and the follow-up question stops being a threat. It becomes a click away that drives home confidence in your numbers and your value to the principle.
The ten dashboards below are grouped by the four questions a family office is really being asked. The last group is the one most offices skip, and the one that decides whether the first three are believed.
What do we own?
1. Interactive wealth map
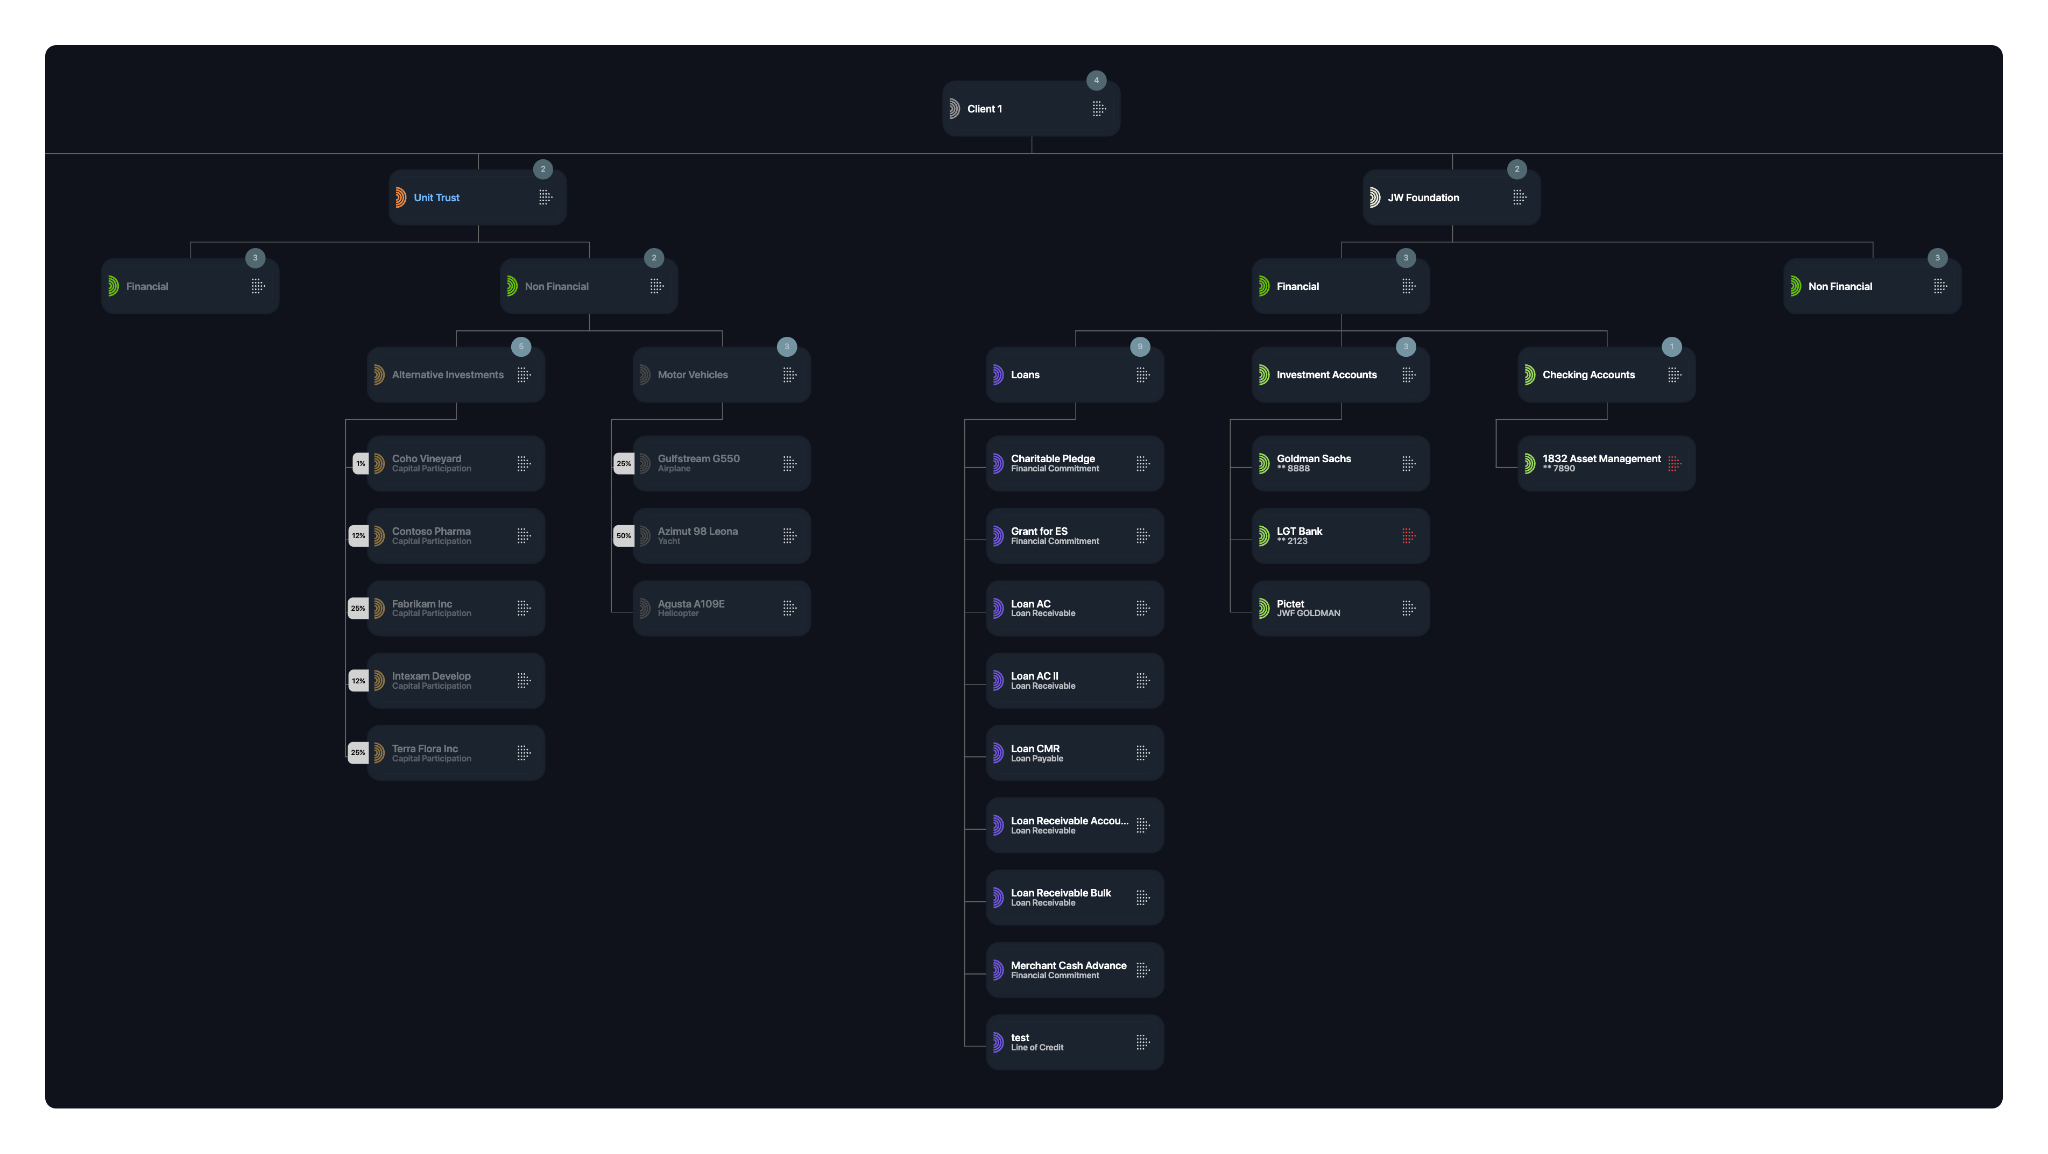
For an ultra-high-net-worth family, “what do we own” is rarely a list. It is a structure. Assets are held whole or in part across trusts, joint ventures, holding companies and investment vehicles, and the same underlying asset can appear at three levels of the chart.
Why it matters
A traditional balance sheet flattens that structure and loses what the family actually needs to see: who owns what, at what percentage, through which entity. Reassembling it across spreadsheets is slow and, more importantly, unverifiable. The clearest presentation is a visual map displaying every legal entity in the portfolio and the connections between them.
Key elements
- A visual tree mapping all assets, linked to each holding.
- Every asset type: real estate holdings, collectibles, private equity investments, operating businesses, loans, crypto.
- Value and ownership percentage per asset, with look-through to the underlying holding.
- Drill-down from any node to the account, asset and transaction beneath it.
- Succession-ready dashboards that model generational transfers before they happen.
Questions it answers
- What is the complete picture of everything we own, across every structure?
- If we want to make an investment or a gift, which assets are available and unencumbered?
- What are our ownership interests in a given asset?
- How is wealth allocated across family members, trusts and generations?
Where it breaks
Double-counting is the common issue inside a complex wealth structure. When one asset is held through several layers and the platform does not understand the ownership mapping, the consolidated number is wrong in a way that is hard to spot and easy for a family member to catch.
Masttro’s Global Wealth Map is built for exactly this. You can access a walkthrough of the interactive wealth map if you want to see it in motion.
Daniel Forman, CIO of Jefferson River Capital, called it “by far the easiest platform to add assets and to see our family mapping.”
2. Portfolio overview
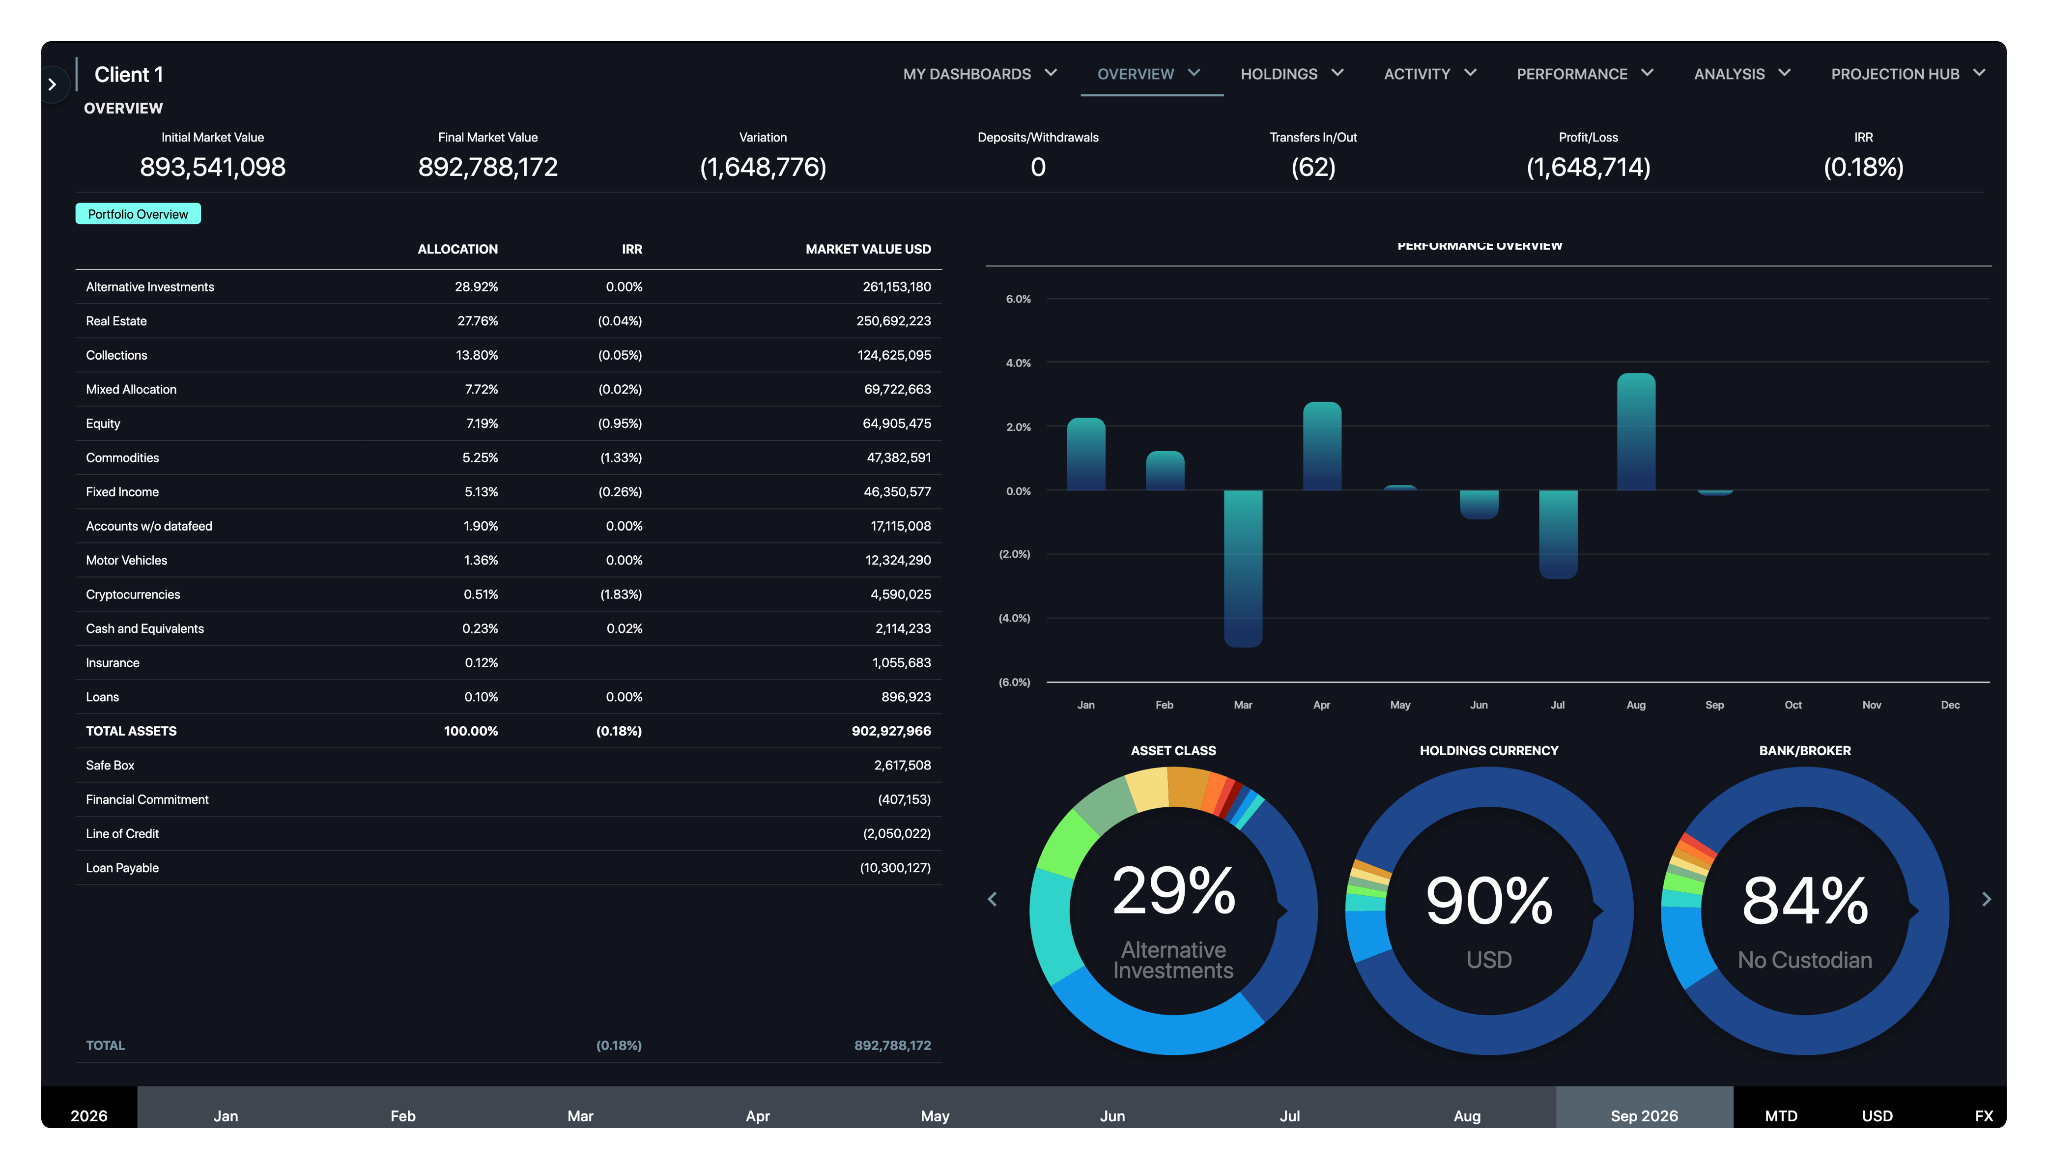
Whether you run a single or multi-family office, the portfolio overview is the cornerstone view — the one a principal opens first and the one an investment team lives in.
Why it matters
Families want on-demand access to every part of a complex portfolio — cash balances, alternative assets and listed securities — in one integrated view, in one base currency, as of one date. Getting there means data aggregation across custodians, private banks and asset managers, plus extraction from documents that arrive as PDFs. Financial aggregation covers the liquid financial assets; the harder half is everything that does not arrive on a feed. Masttro pulls multi-custodial data from 700+ direct custodian connections across 40+ countries, so the overview is a real-time view rather than a monthly reconstruction.
Key elements.
- Holdings categorised by asset class, with public and private assets clearly separated.
- Performance by period (MTD, QTD, YTD, since inception), with the methodology labelled.
- Internal rate of return alongside time-weighted return, and a stated reason for each.
- Asset allocation against investment strategies and policy targets, with drift highlighted.
- Portfolio valuations across multi-currency accounts, with a consistent base currency.
Questions it answers.
- What are we invested in, and in what proportion?
- How is the portfolio performing, and what is driving the result?
- Where has allocation drifted away from policy?
Where it breaks
Definitions drift. One person quotes money-weighted returns, another quotes time-weighted, both are correct, and the meeting becomes an argument about arithmetic. Label the method on the view and keep it identical everywhere.
Consolidated portfolio analysis is the module behind this view, and the portfolio management center is where allocation is measured against the investment policy statement. Stonebridge Family Office uses it live in client meetings against real-time benchmarks.
3. Lifestyle and passion assets
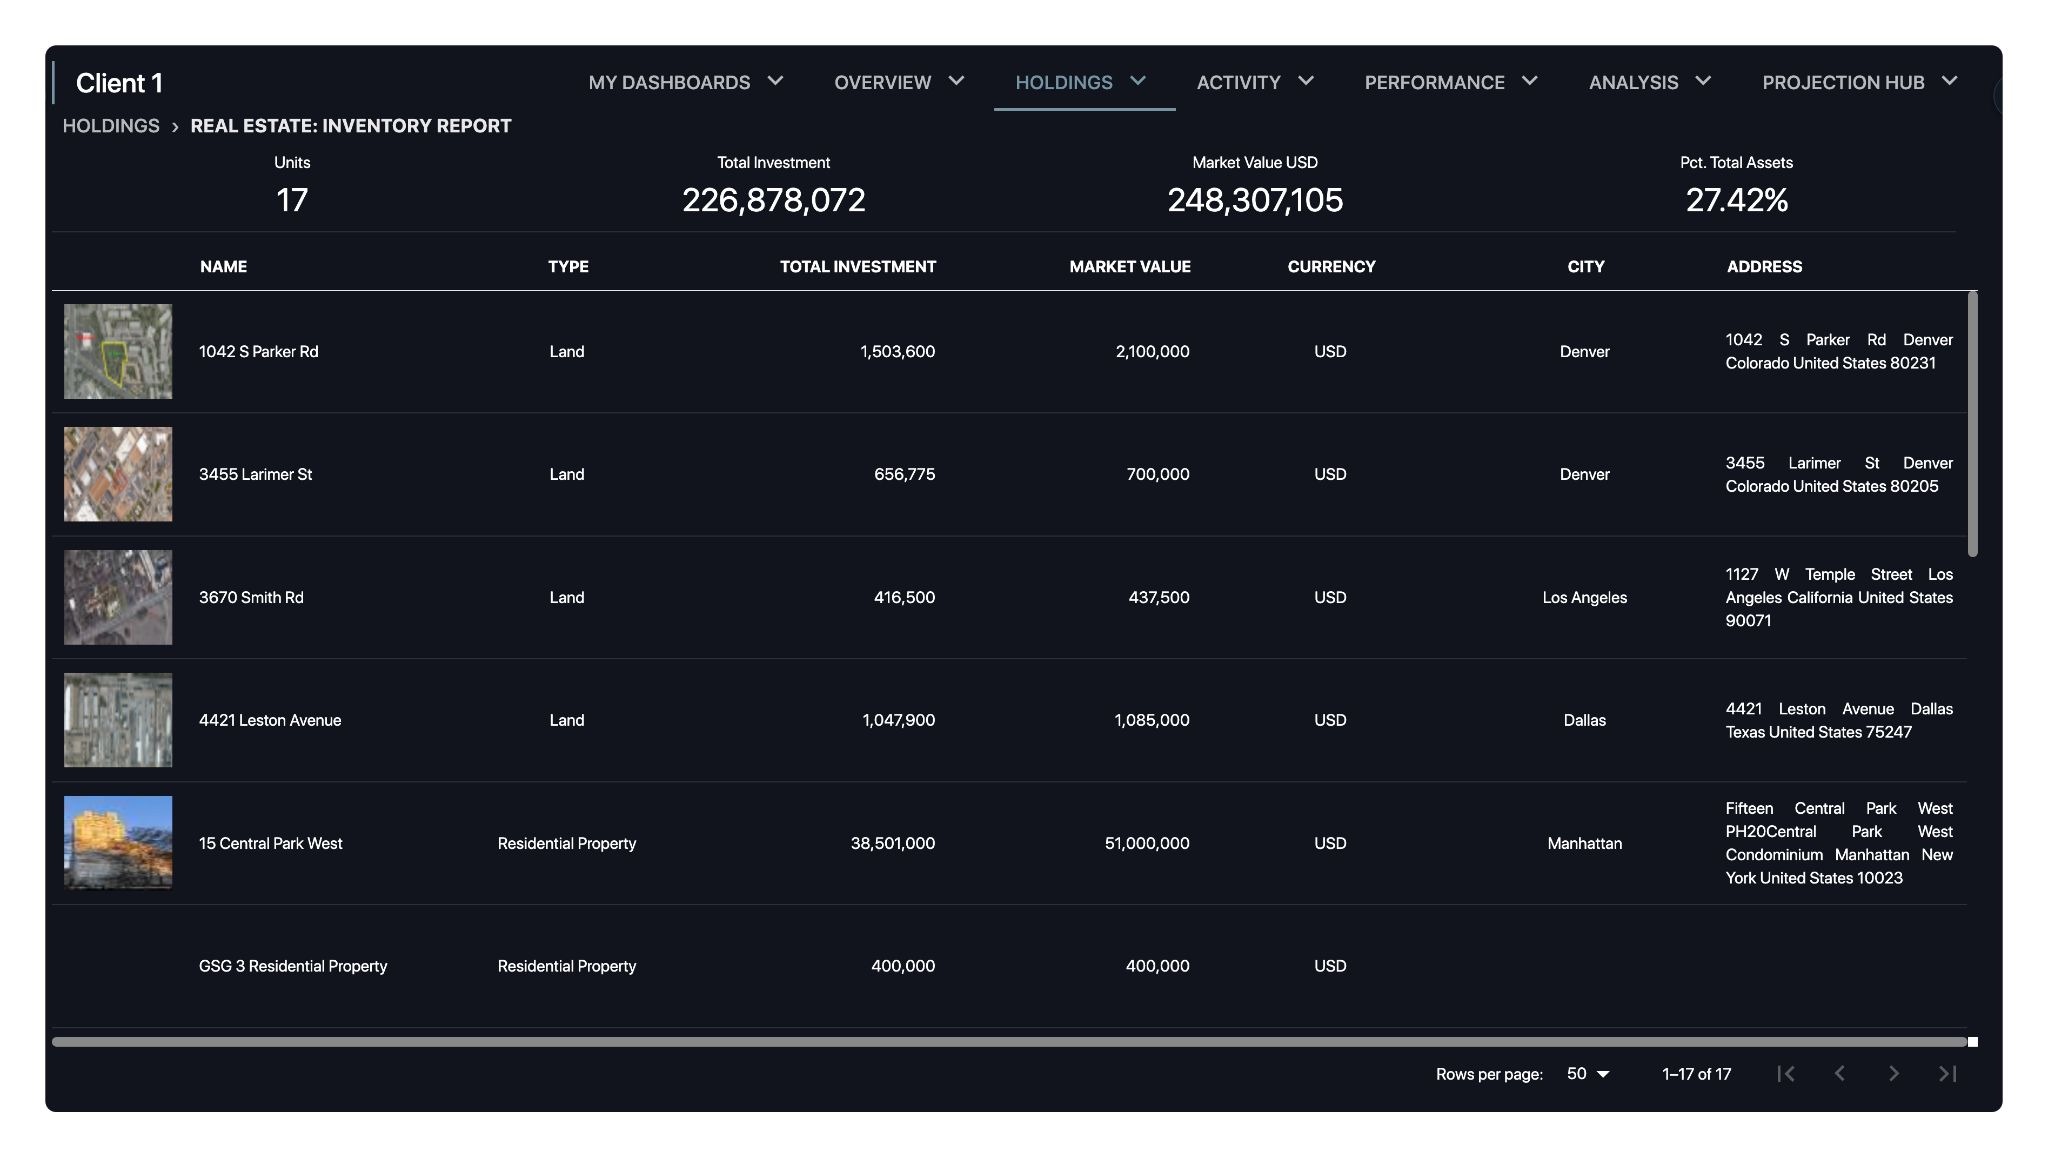
Most reporting platforms treat art, real estate holdings, aircraft, yachts and collections as a footnote, or leave them out. For many families they are a material share of net worth and nearly all of the emotional weight.
Why it matters
A dashboard showing a family 70% of what they own is not a single source of truth. It is a portfolio report with a gap the family fills from memory. Insurance renewals, appraisal dates, ownership transfers and estate planning all depend on these assets being tracked with the same rigour as a listed equity position.
Key elements
- Each asset with acquisition cost, latest valuation and valuation date.
- The legal entity or family member holding it, and the ownership percentage.
- Supporting documents attached to the asset — appraisals, insurance policies, provenance.
- Lifestyle assets as a share of the total net worth view.
Questions it answers
- What do we own outside the investment portfolio, and what is it worth today?
- Which valuations are out of date, and which appraisals are due?
- How much of the family’s net worth is illiquid by nature rather than by choice?
Where it breaks
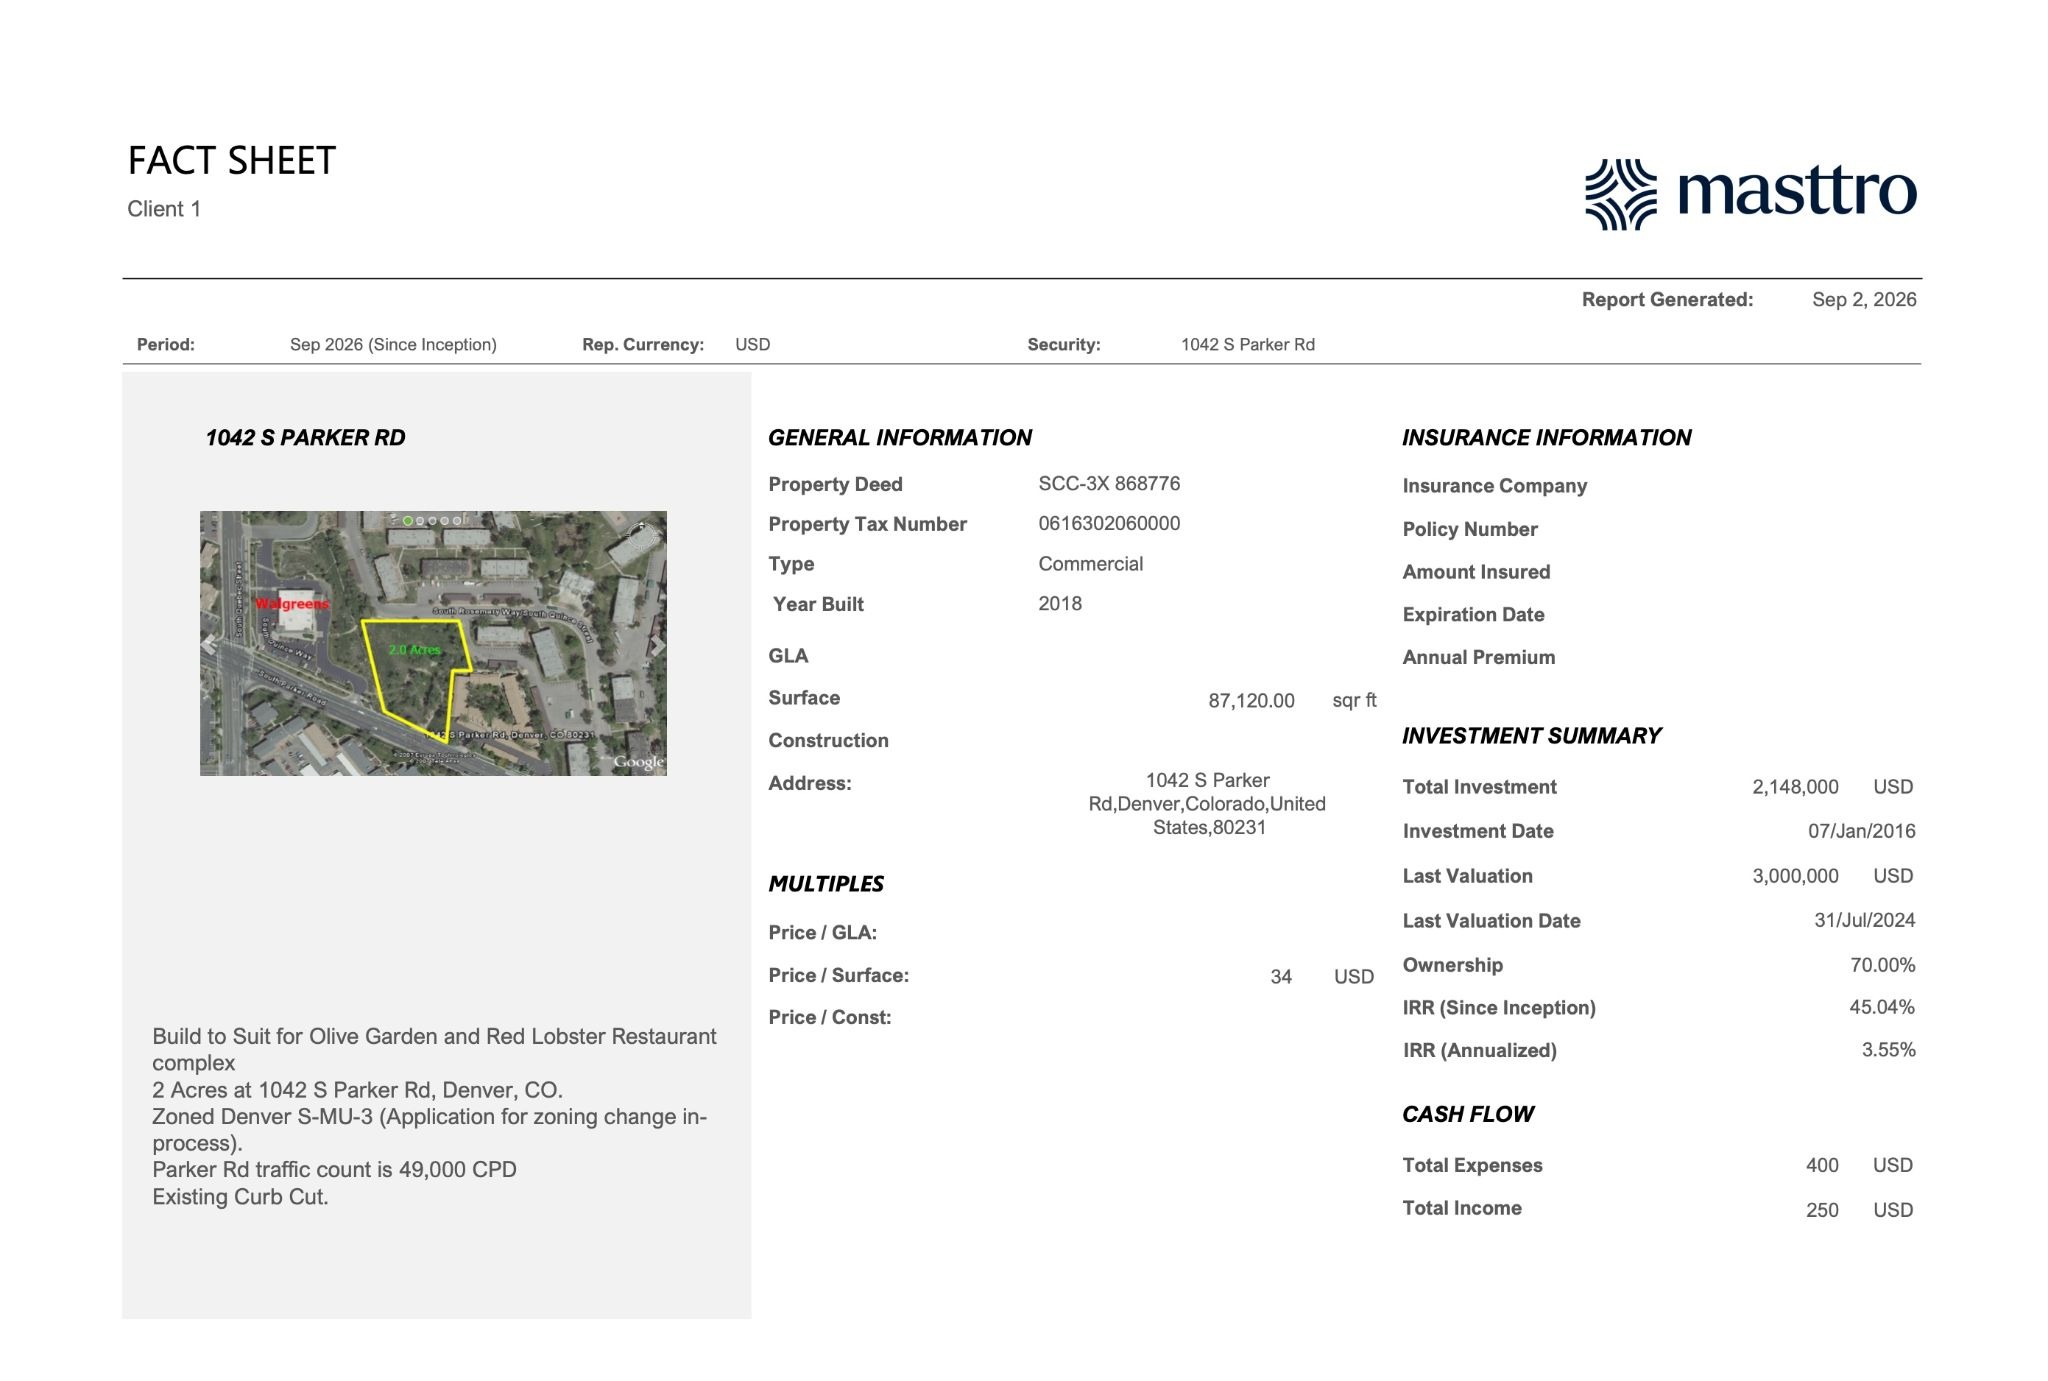
The core issue for lifestyle assets like real estate, is that valuations become stale and nobody flags it. A property carried at a 2019 appraisal is not a current number and should not be presented as one. The solution is showing the age of a value next to the value. Masttro carries a valuation date on every holding and flags the ones that have gone stale, while Alternatives AI processes capital statements as they arrive and Documents AI takes the date off the NAV statement rather than waiting for someone to key it in. Knowing which numbers are current, and by how much they are not, is what changes the decision.
How is it performing?
Advisor and manager performance
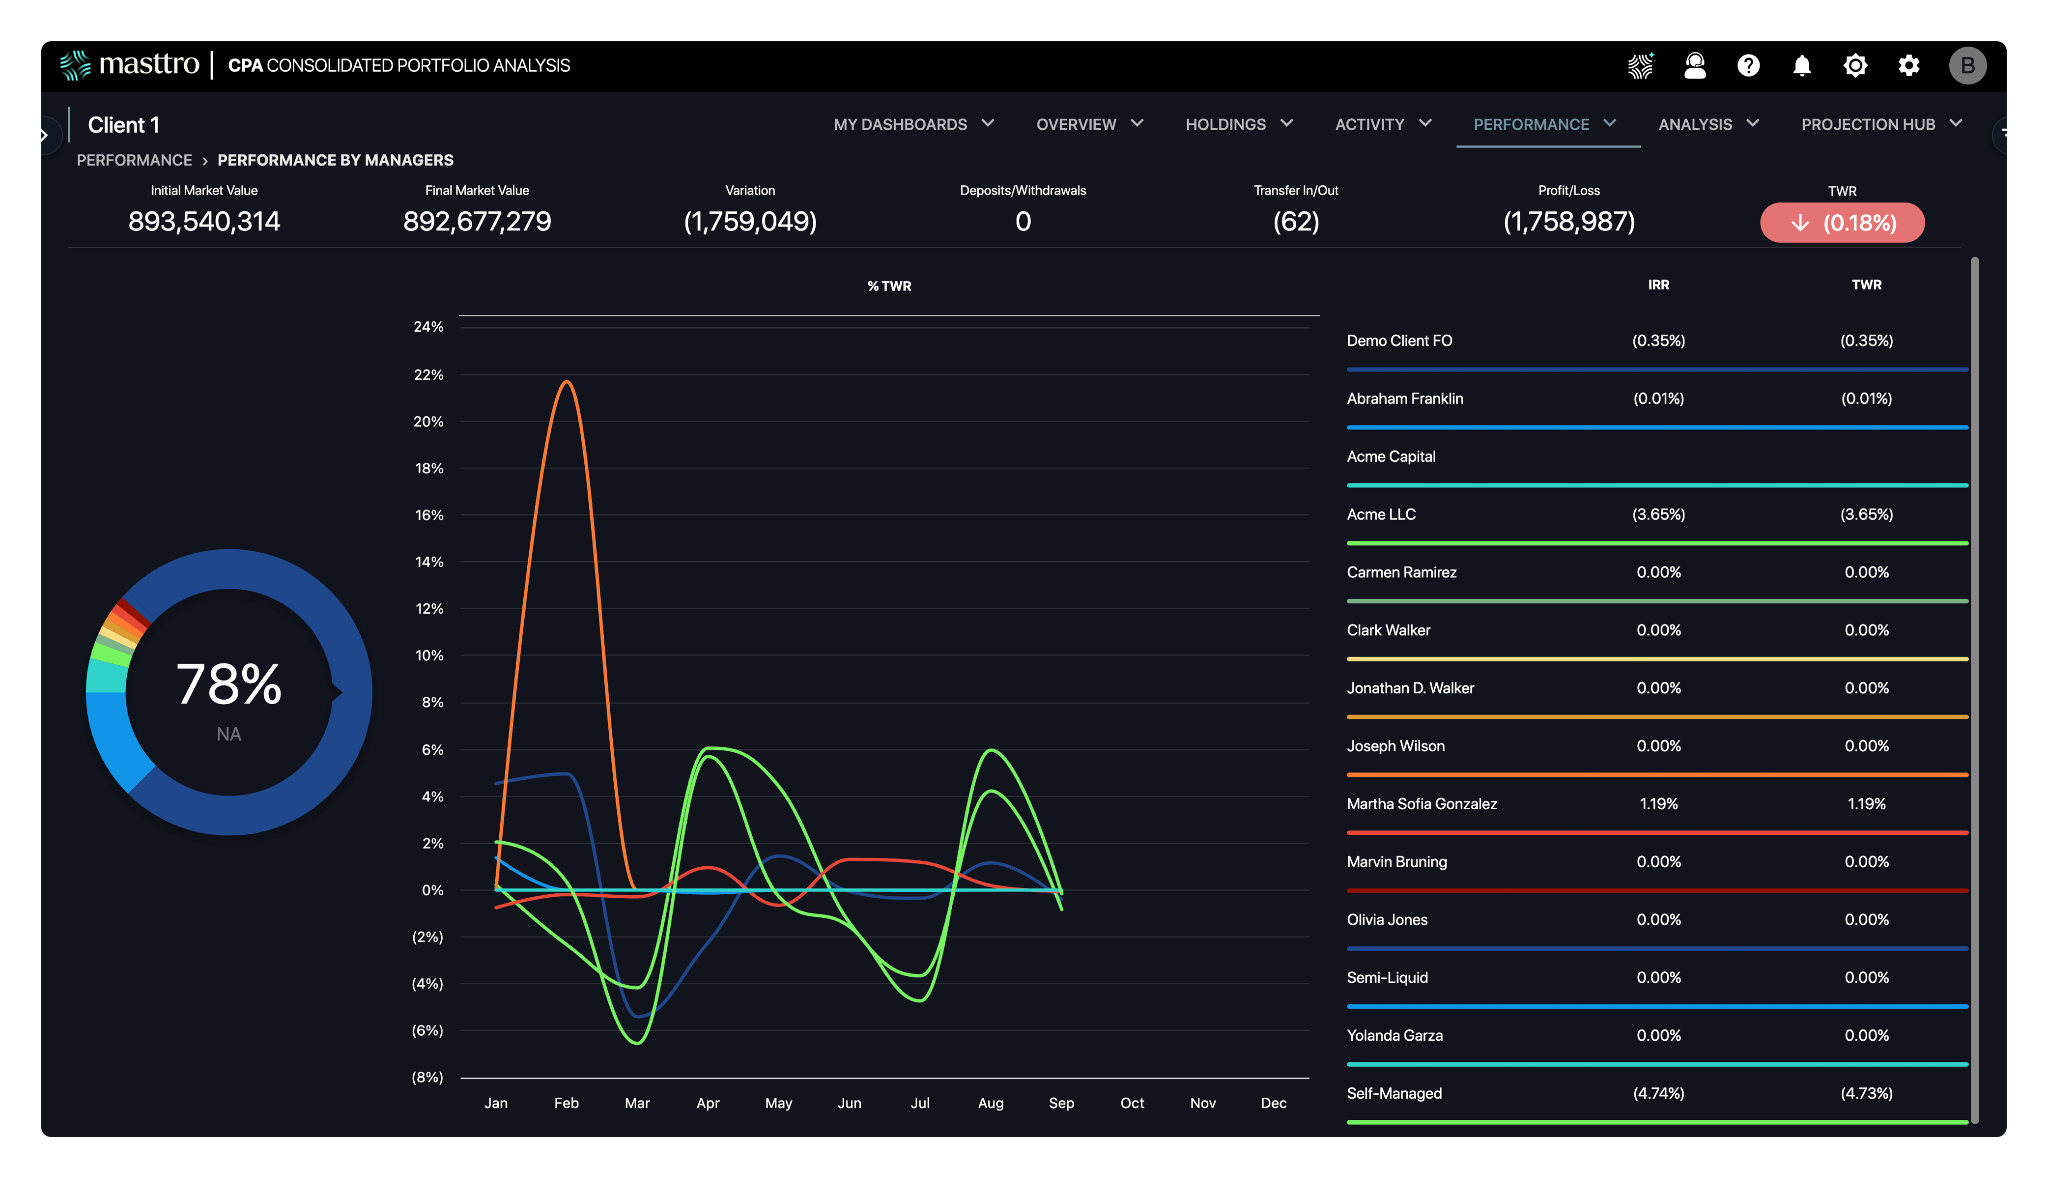
Complex family offices rely on multiple managers across asset classes, from private equity to public equities. Tracking each one individually, net of fees, on a comparable basis, is where a lot of manual work hides.
Why it matters
An advisor performance view tells the family office team which relationships earn their fee and which mandate should be re-scoped or ended. It also answers a governance question raised at every annual review: has diversifying across managers actually reduced risk, or just multiplied the paperwork?
Key elements
- Amount allocated to each manager, with current and target weight.
- Performance tracking over time against a custom benchmark.
- Side-by-side IRR and time-weighted return, with the method labelled for each.
- Fee insights and controlling — what each manager is paid, and the return net of it.
- Exportable quarterly reports per mandate.
Questions it answers
- How are our money managers performing against their mandates and benchmarks?
- Have we reduced risk by diversifying across managers, or duplicated exposure?
- What are we paying each manager, and what are we getting for it?
Where it breaks
Managers get compared on gross returns, because the net-of-fee numbers live in the accounting system and the dashboard is fed by the reporting one. Management fees, advisory fees and account-level expenses never reach the view, so two managers who look 80 basis points apart on screen can be level once the cost of holding each is counted. The one that looks best is sometimes just the one charging most for the same result.
The solution is to make fee treatment an explicit choice on the view rather than an assumption behind it. Masttro's performance by manager report offers three: gross of fees, net of management fees, and net of all fees, which takes in advisory and account-level expenses as well. You set it in the filters panel, and the fees behind any net figure can be opened and checked line by line in the advisory and management fee and account expense grids, so a number a family questions can be traced rather than defended.
5. Risk and concentration
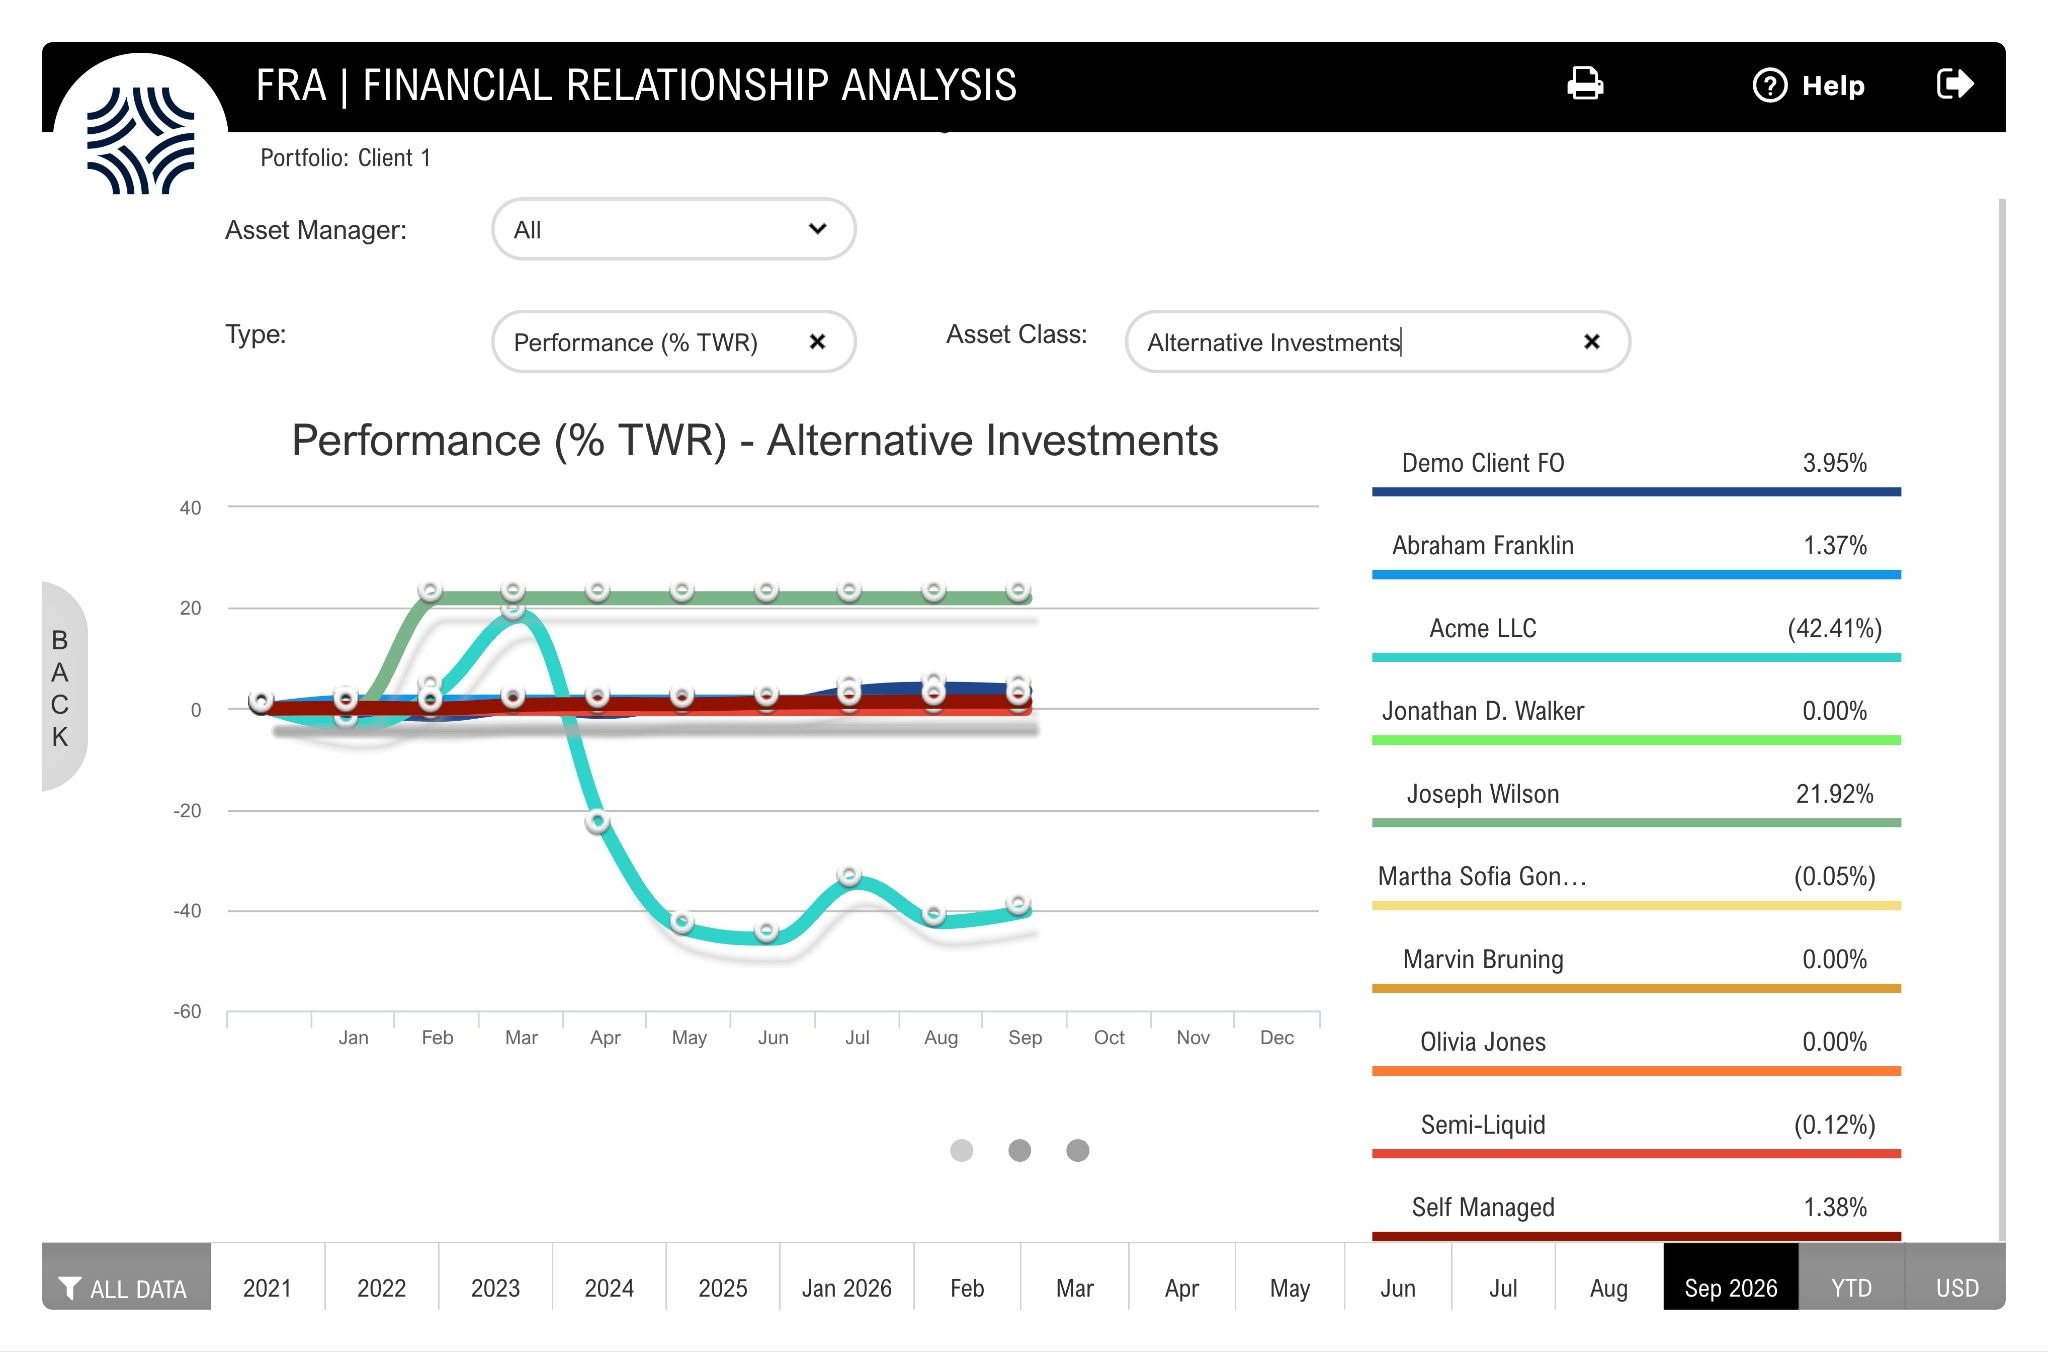
Allocation tells you where the money sits. Concentration tells you where the family is exposed if one thing goes wrong.
Why it matters
Ultra-high-net-worth portfolios accumulate concentration by accident. A single operating business, a founder’s stock position, one sponsor across four funds, or three real estate holdings in the same submarket. None of it appears in an asset-class pie chart, and all of it matters.
Key elements
- Look-through exposure to single issuers, sponsors and counterparties across every fund and vehicle.
- Largest holdings as a share of total net worth, at family level rather than account level.
- Sector, vintage year and strategy exposure across private-market exposures.
- Liquidity profile — what converts to cash in a week, a quarter, a year, or not at all.
Questions it answers
- What is our true exposure to any single name, sponsor or sector once we look through the funds?
- What share of net worth sits in assets we could not sell inside a year?
- Where are we accidentally concentrated?
Where it breaks
Exposure measured at fund level rather than holding level, so the same underlying position held through three managers reads as diversification.
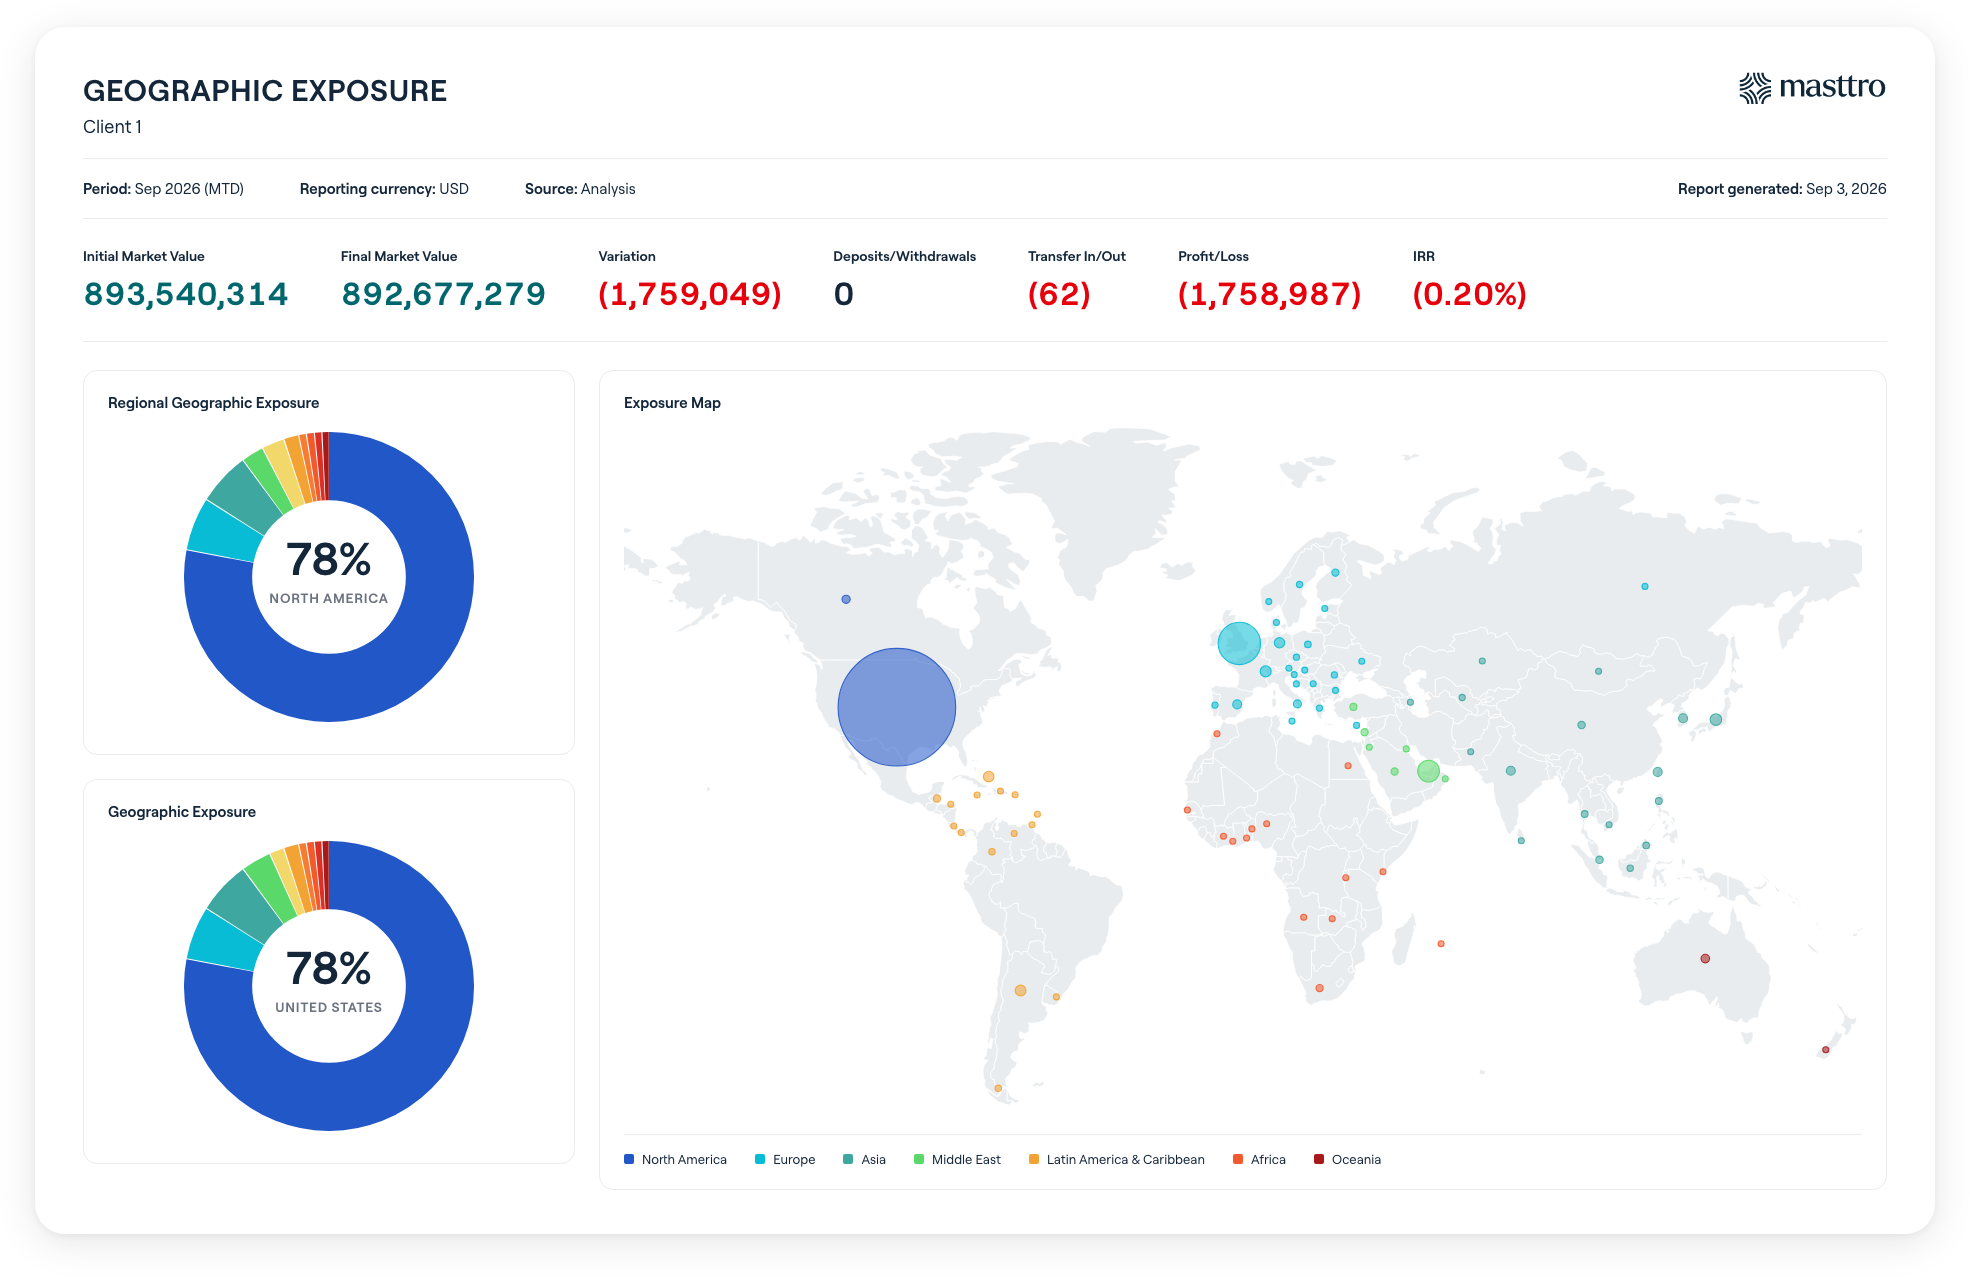
6. Geographic and currency exposure
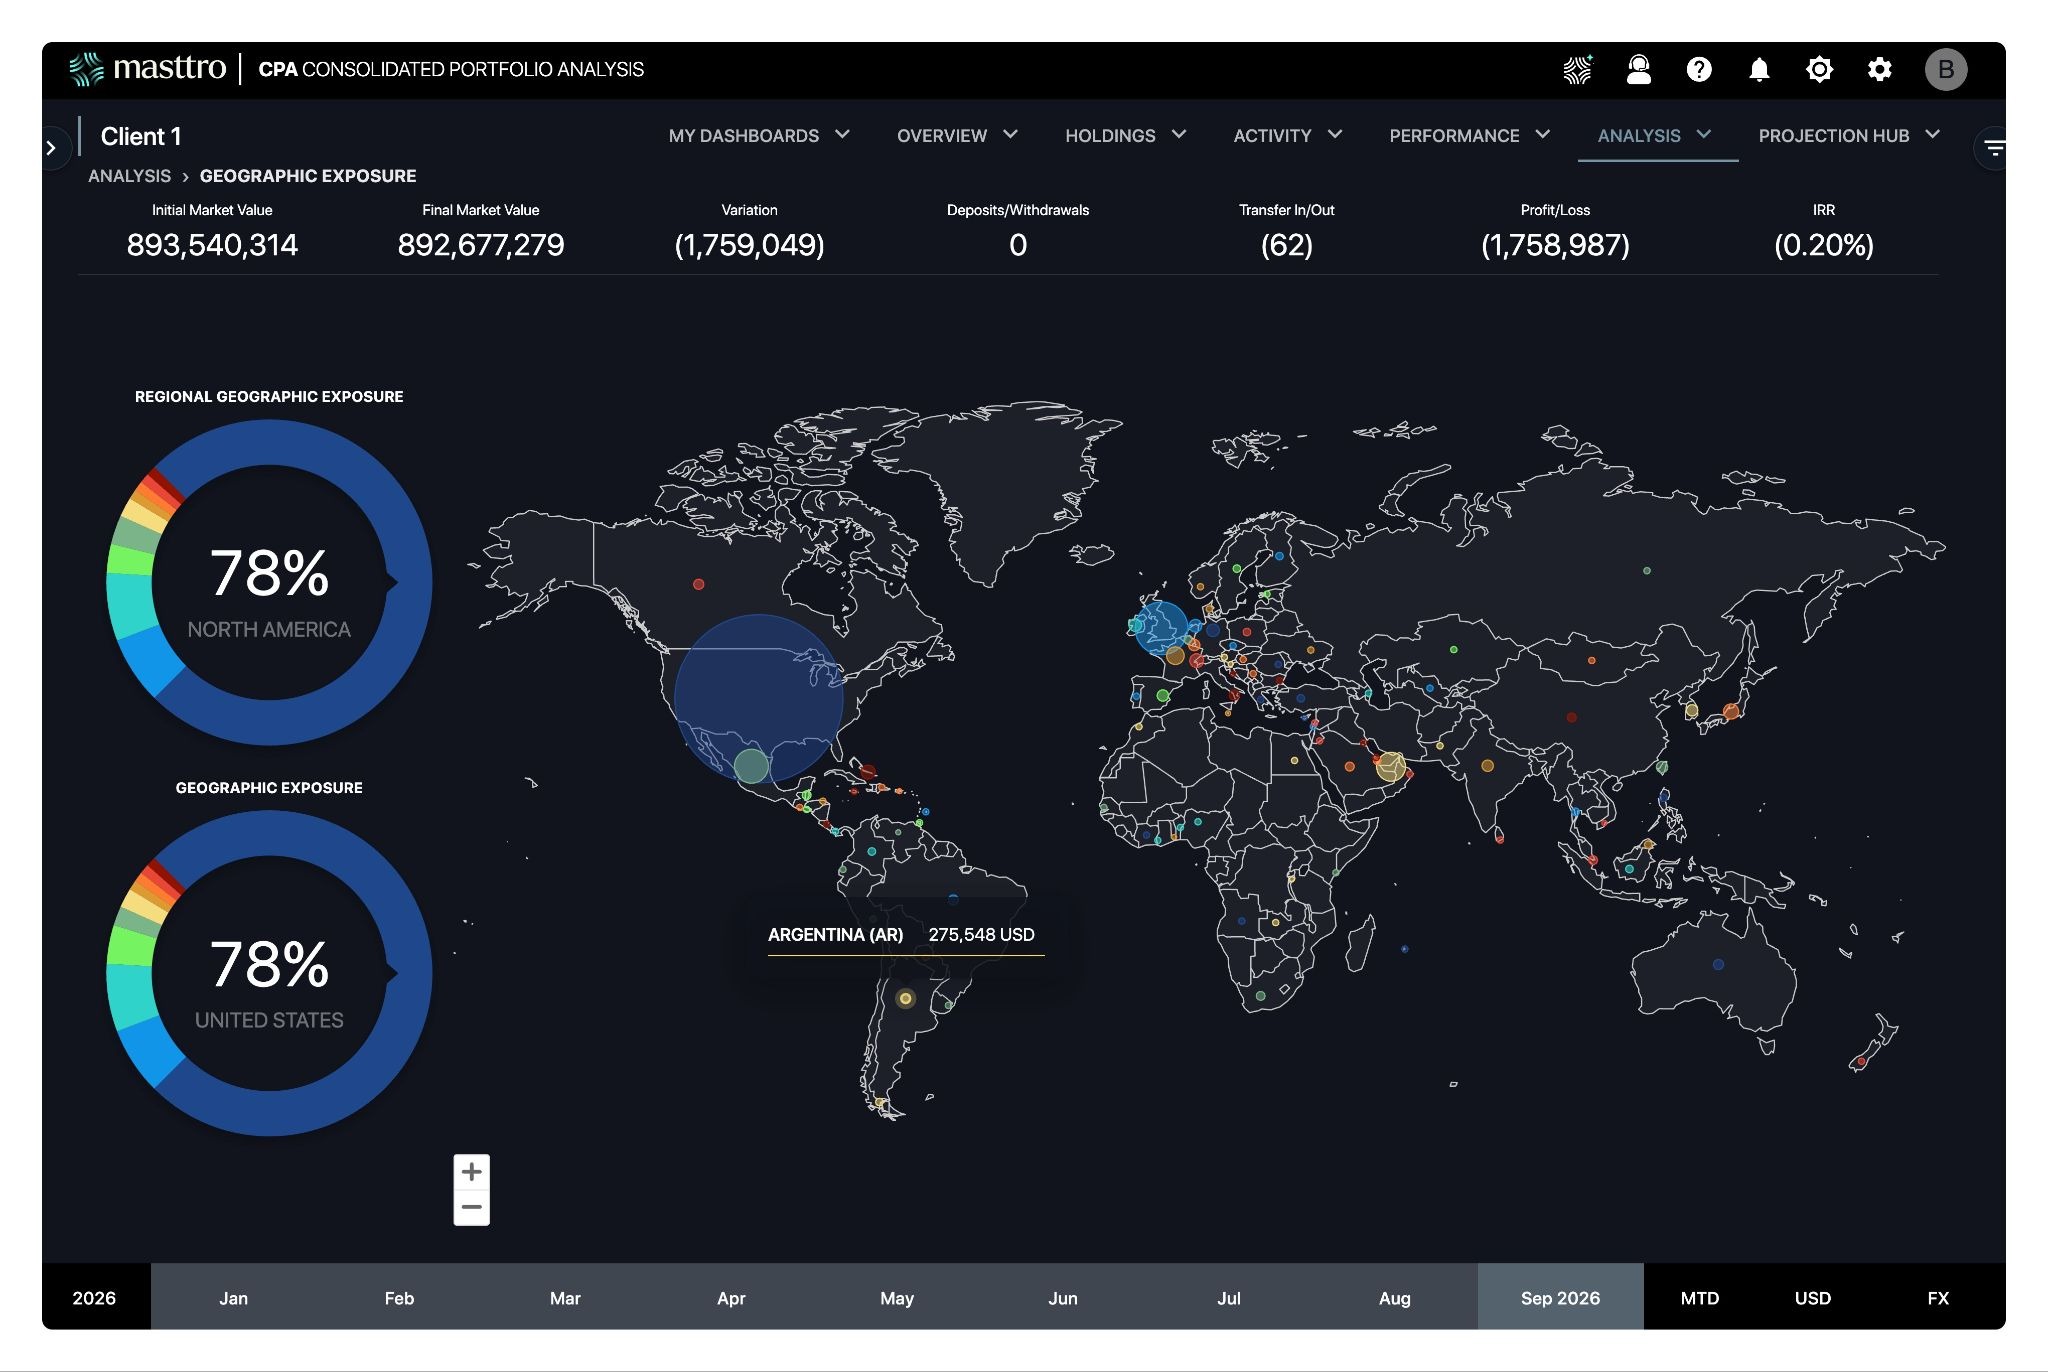
Wealth is increasingly spread across regions, each with its own market dynamics, tax treatment and geopolitical risk. That is as true of American families investing overseas as of global families placing capital in the United States.
Why it matters
A geographic view lets a family office team see the global picture at a glance and spot disproportionate concentration in one country. Layered onto it, currency exposure answers a question consolidated reporting often obscures: how much of last year’s return was performance, and how much was the dollar?
Key elements
- Investment allocation by region and country, on a world map with drill-down.
- Exposure across multi-currency accounts, with the FX contribution to return isolated.
- Jurisdiction of holding entities alongside jurisdiction of assets — they are not always the same.
- Regional risk filters for scenario review, and the reporting cuts tax compliance work depends on.
Questions it answers
- How geographically diversified are we, and where are we concentrated?
- How much of our reported return came from currency movement rather than asset performance?
- Which jurisdictions hold the assets, and which hold the legal entities?
Where it breaks
Multi-currency portfolios are reported in a single base currency with no FX attribution, so the family cannot separate performance from translation.
Masttro reports multi-currency and multi-domicile across countries by default, secured with sovereign-grade isolation on a Swiss private cloud — not even Masttro employees can access client data.
What is coming next?
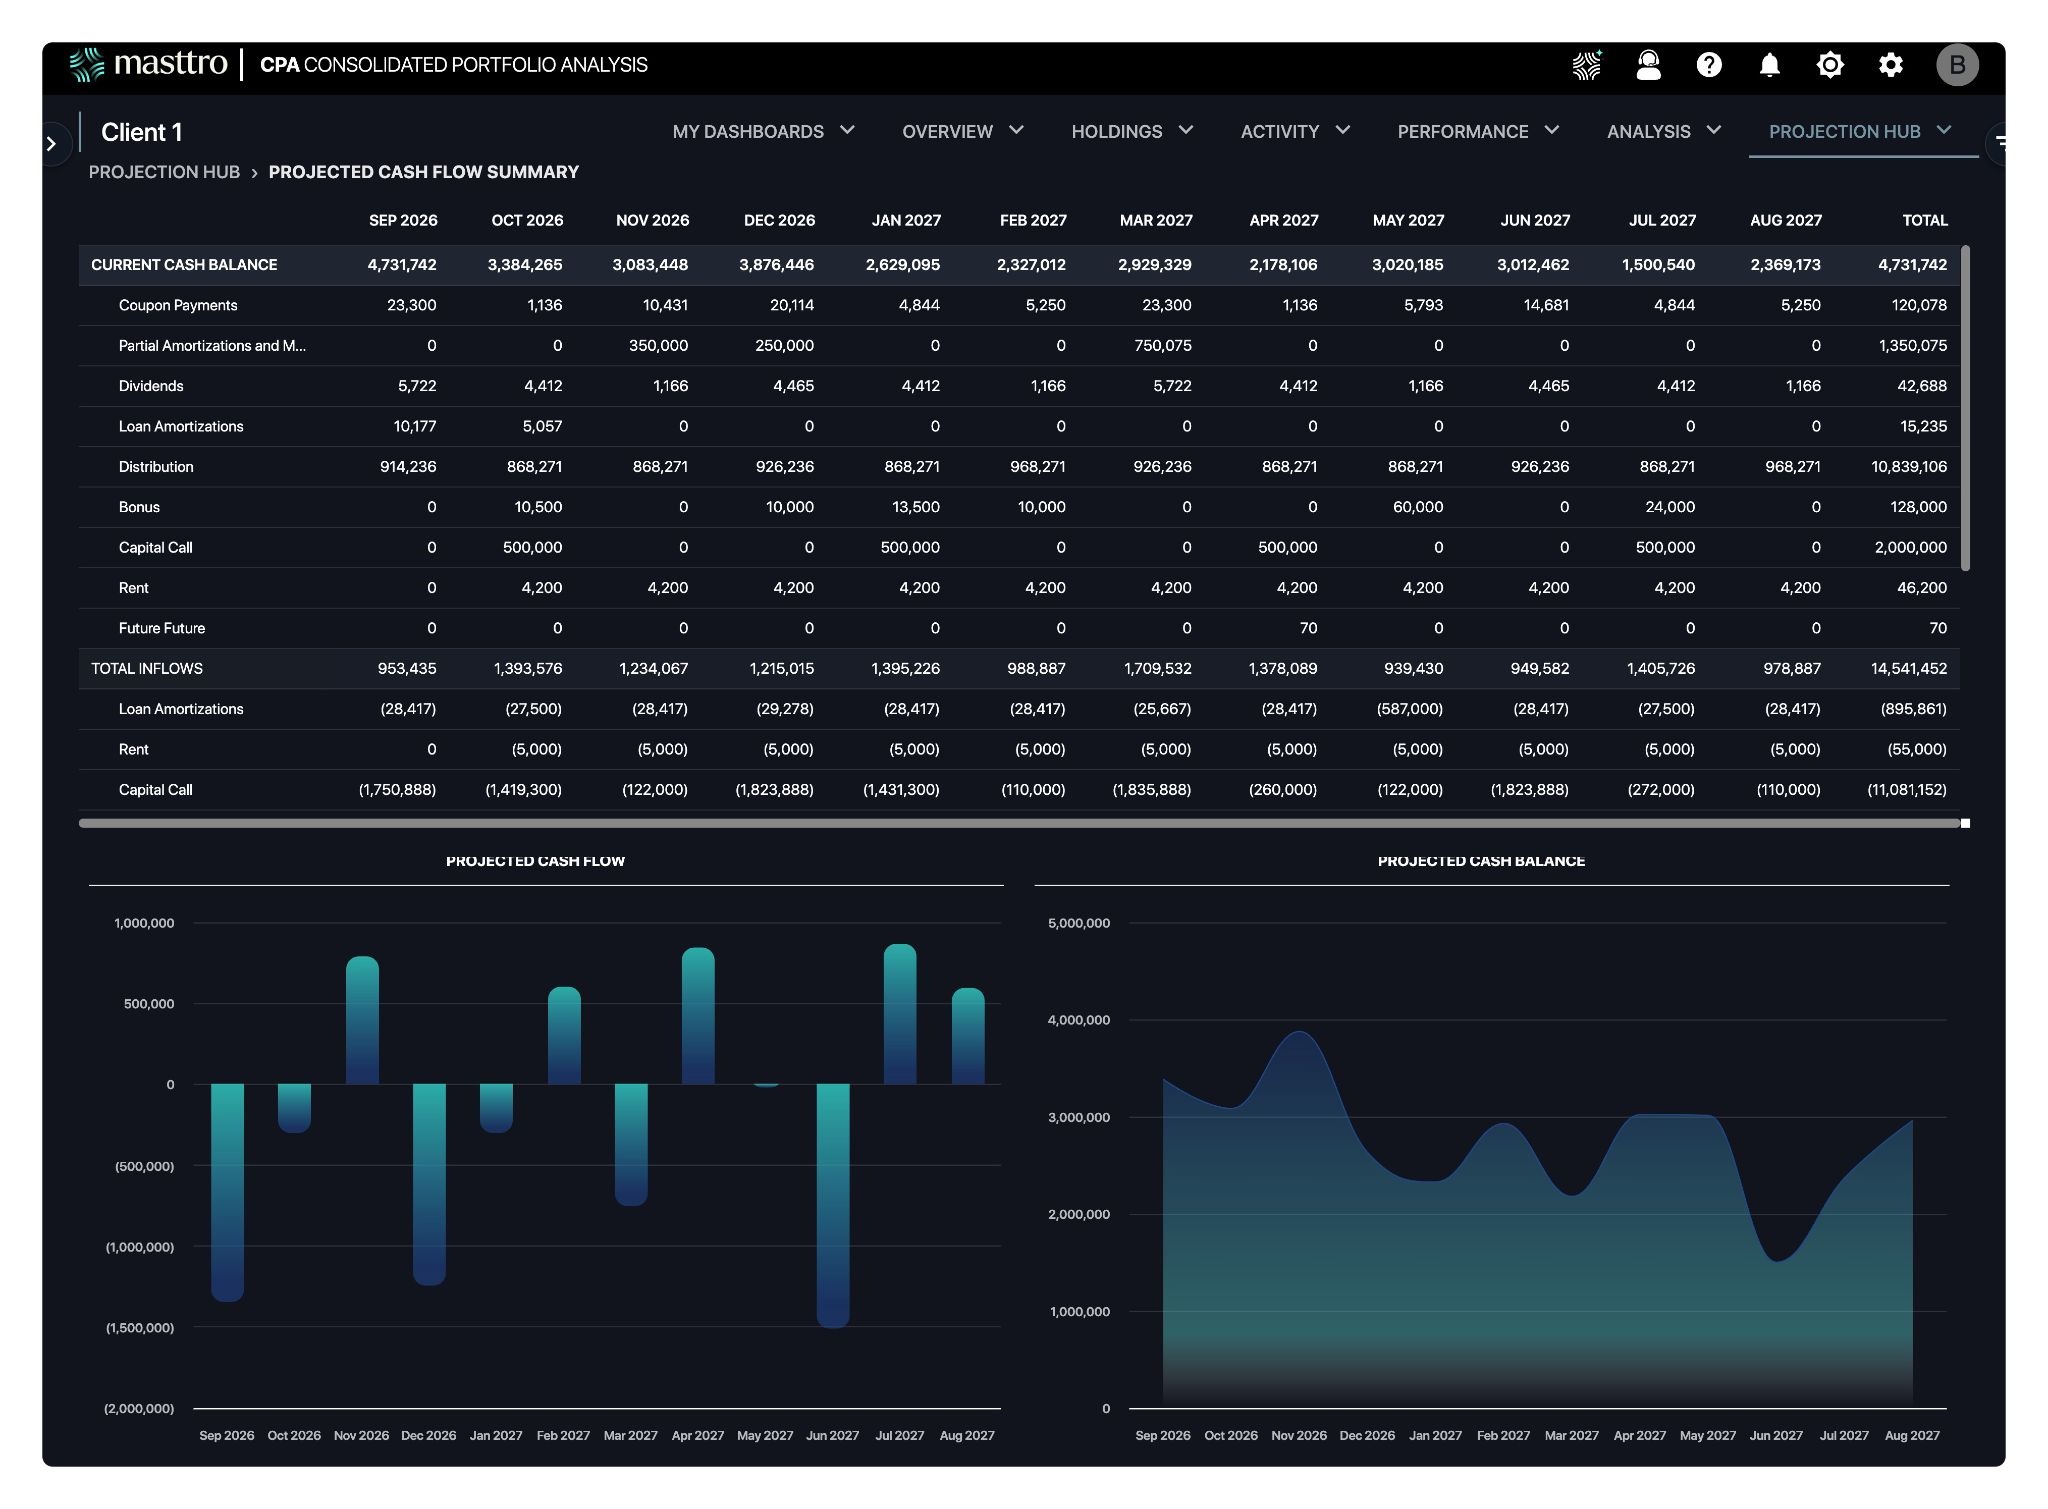
7. Cash flow forecast and liquidity runway
Between credit lines, capital calls, distributions, tax estimates and operating spend, a family office needs clarity on cash at all times.
Why it matters
Families rarely get into trouble because they misjudged an IRR. They get into trouble because a liquidity pinch arrived earlier than the forecast showed. On-demand visibility into near-term inflows and outflows keeps the office ready to fund an obligation and free to act on an opportunity that will not wait for the next reporting cycle. For an outsourced CFO or a controller carrying accounting oversight across several entities, this is the view that runs the week.
Key elements
- Month-by-month projection of inflows and expenses, with forecast items labelled as forecast.
- Net cash position by legal entity, not only by account — cash in one entity is not always usable in another.
- Scheduled inflows: dividends, coupons, distributions, rent.
- Known obligations: tax estimates, debt service, planned spend, upcoming capital calls.
- A runway figure — months of coverage at current spend.
Questions it answers
- How much cash will be available for spending or investing, and when?
- Do we need to free up cash to cover an obligation?
- What does our expected cash balance look like over the next twelve months?
Where it breaks
Cash shown at account level only. Aggregate cash looks comfortable while the entity that owes the money has none. Cash management has to be entity-aware to be useful.
8. Alternatives and commitments
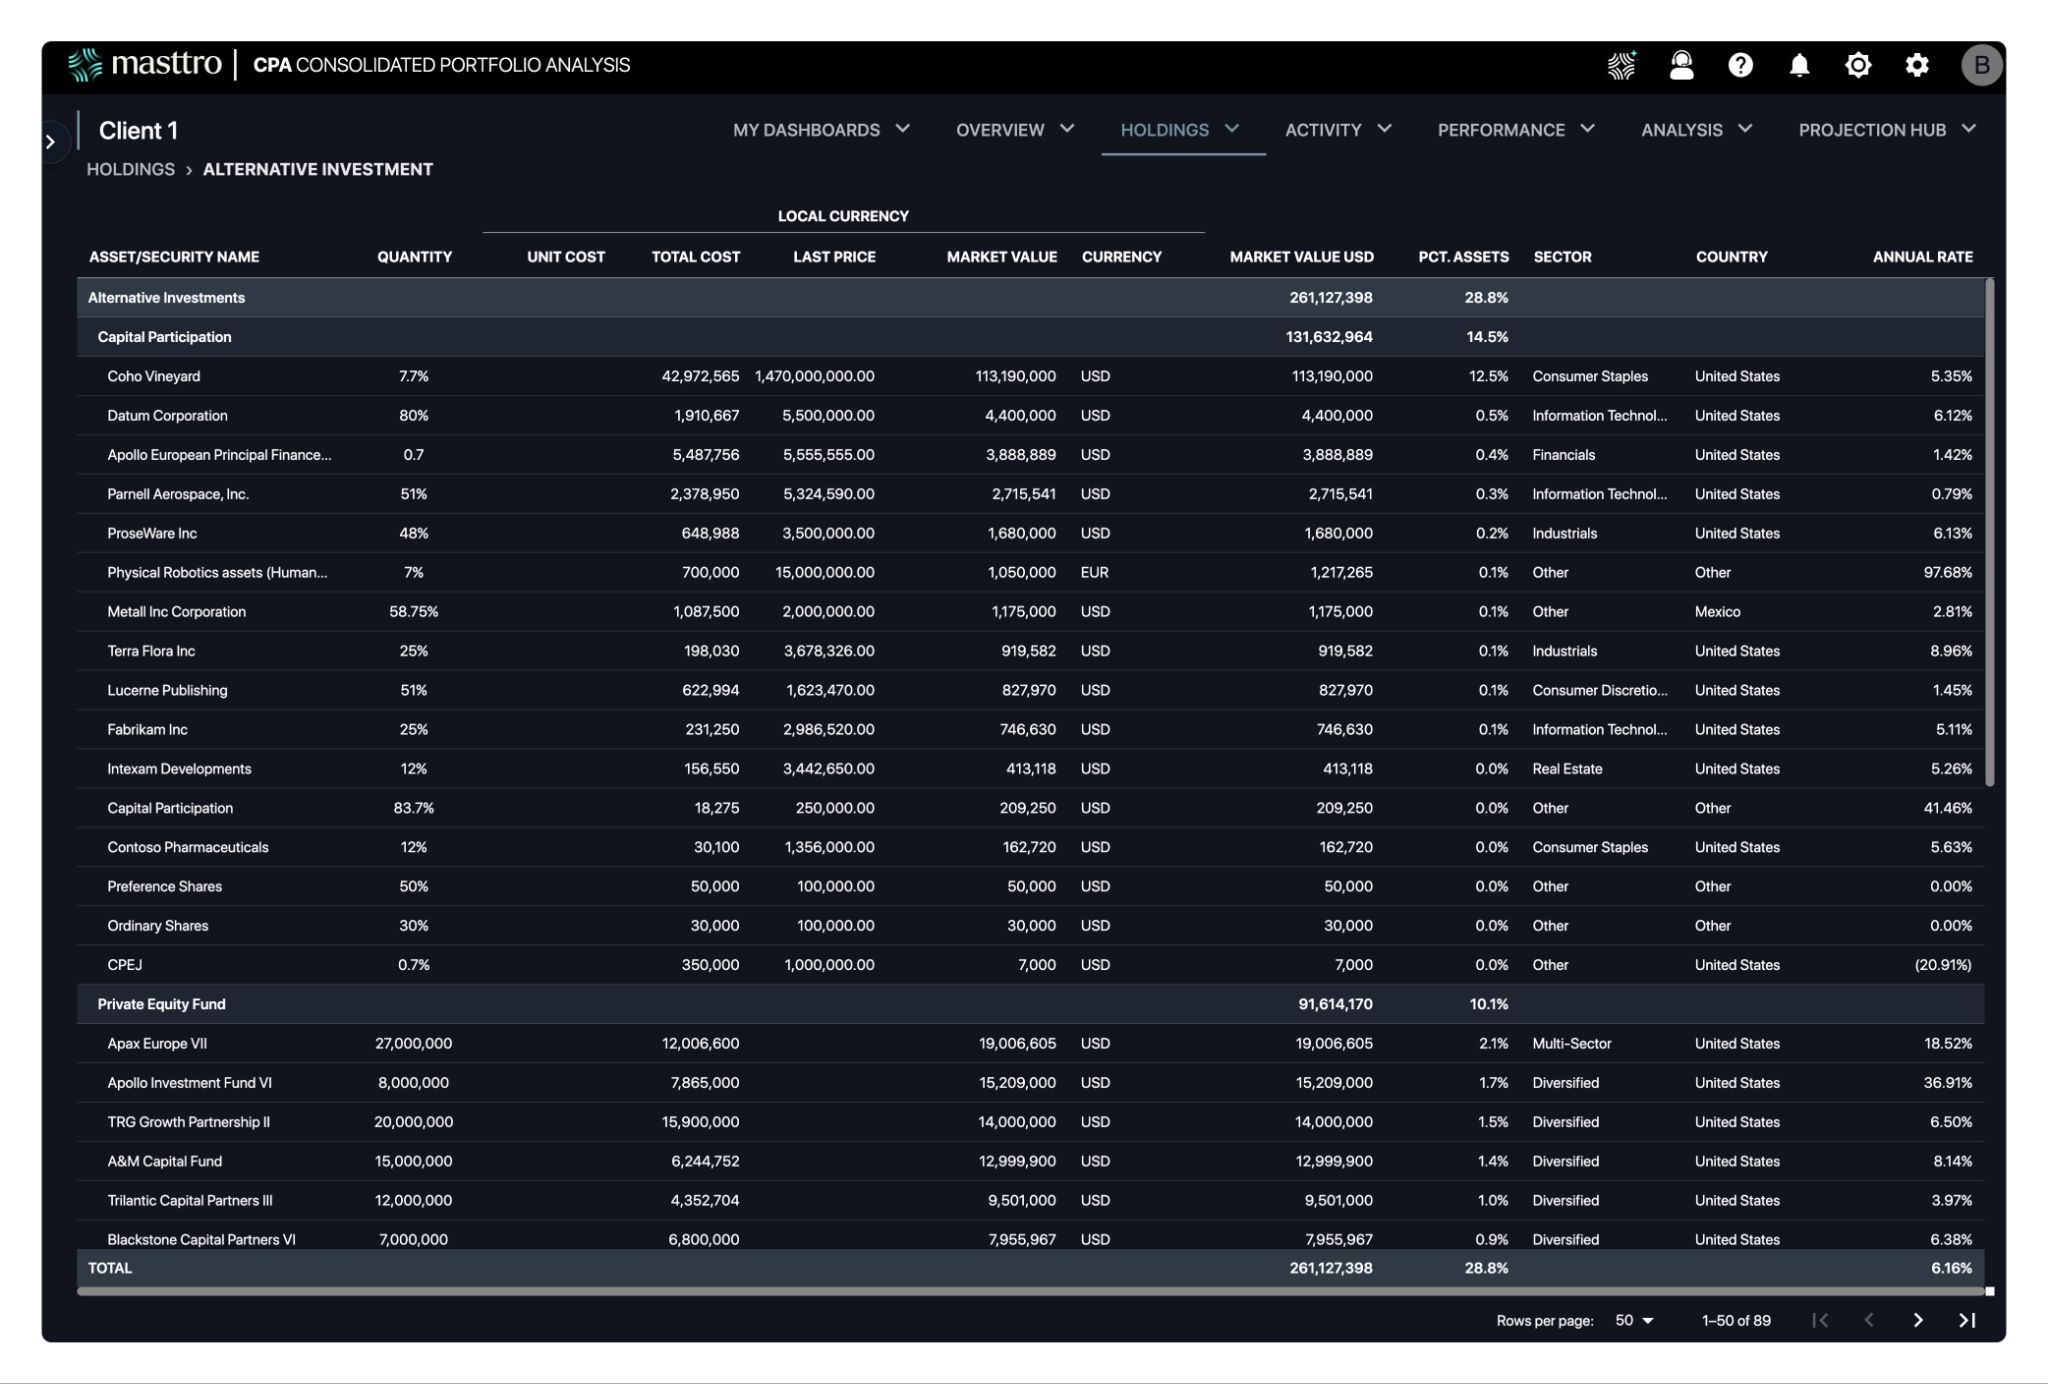
This is the dashboard the earlier version of this article did not include, and the one separating a wealth management platform from a portfolio reporting tool. Masttro tracks more than 300,000 alternative investments.
Why it matters
Private markets are where reporting becomes slow and fragile — the reason 73% of vendors in Simple’s 2025 report named private-market data as their hardest integration problem. Valuations arrive quarterly at best. Capital calls arrive as PDFs on the fund’s schedule, not yours. GP statements need to be tagged, dated and reconciled to a bank account. A portfolio-monitoring platform presenting the private sleeve as though it were daily-priced is not showing the family the truth.
Key elements
- Commitments, called capital and unfunded commitments by fund and by entity.
- Distribution history, DPI and TVPI.
- Latest valuation, valuation date and valuation source, displayed on the view rather than buried in a footnote.
- IRR and multiple on invested capital by vintage, sponsor and strategy — across private equity, venture capital, hedge funds and private credit.
- Pacing — expected calls over the next four quarters, tied into the liquidity view.
- Document status per position: capital call notices, GP statements, Schedule K-1 forms.
Questions it answers
- How much have we committed, how much has been called, and how much is still unfunded?
- What draws should we expect over the next few quarters?
- How current is each private valuation, and which are stale?
- How is the private sleeve performing by vintage and by sponsor?
Where it breaks
Manual entry. Every capital call keyed by hand is a date, an amount and a fund that can go wrong, plus a reconciliation that has to happen twice.
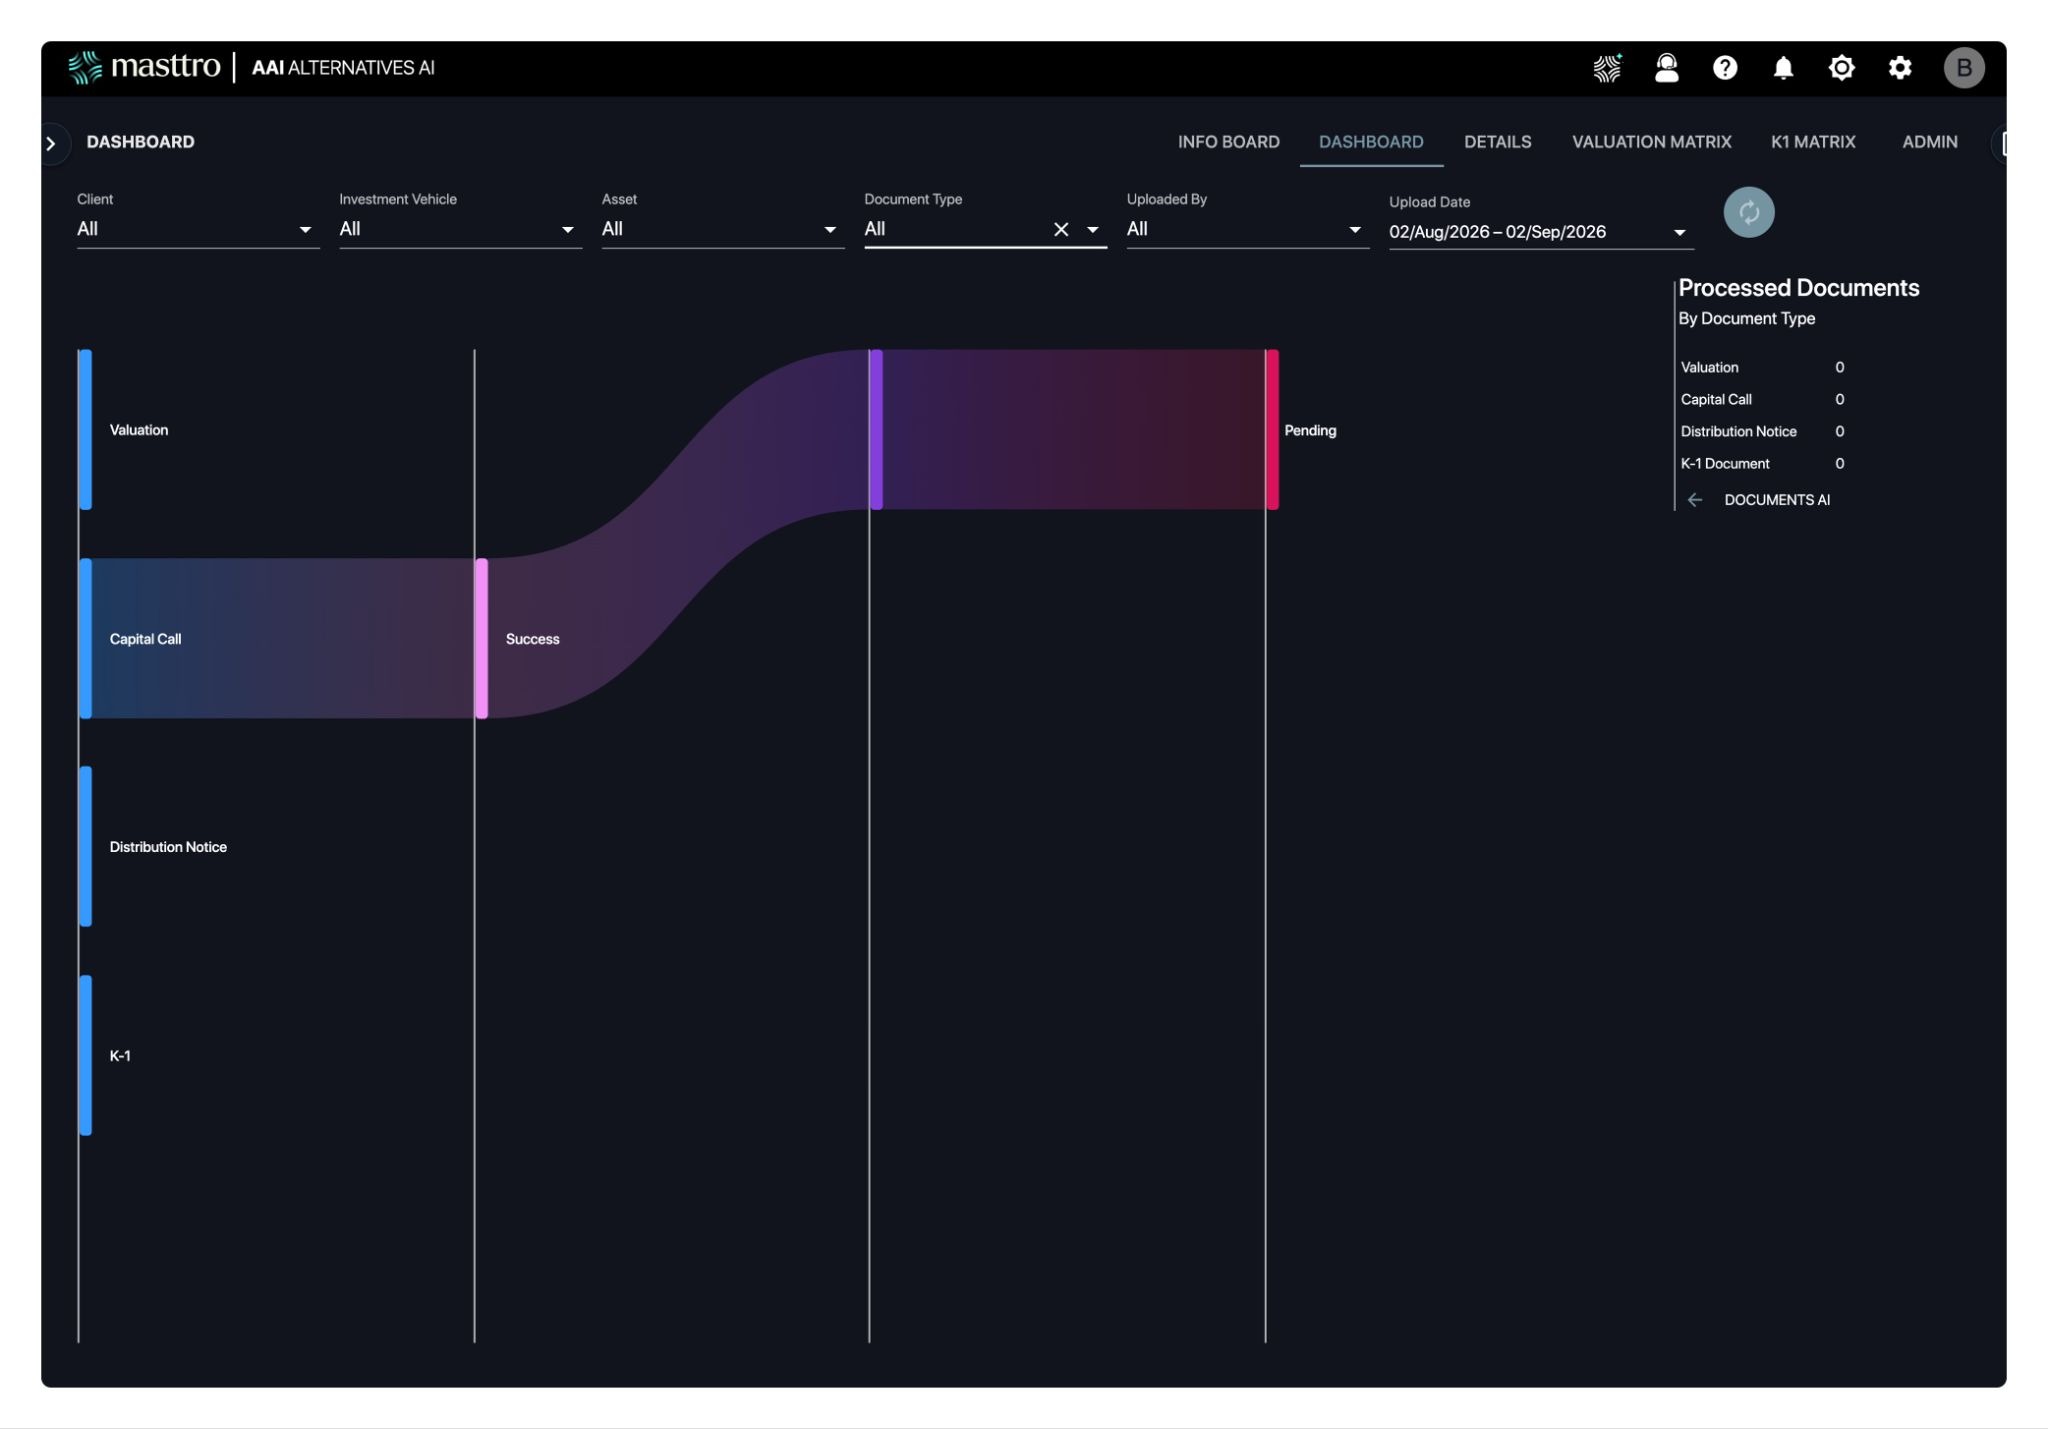
Alternatives AI processes capital calls, distributions and PE/VC valuations directly, which is what private market deal teams need before pacing decisions mean anything. Jefferson River Capital, with more than 200 alternative investments in a $1B+ portfolio, described the effect plainly: “we’re able to tag them appropriately, get the date in, get the amount right, and map it and reconcile it to our bank accounts accurately.”
Can we trust it?
9. Data reconciliation and completeness
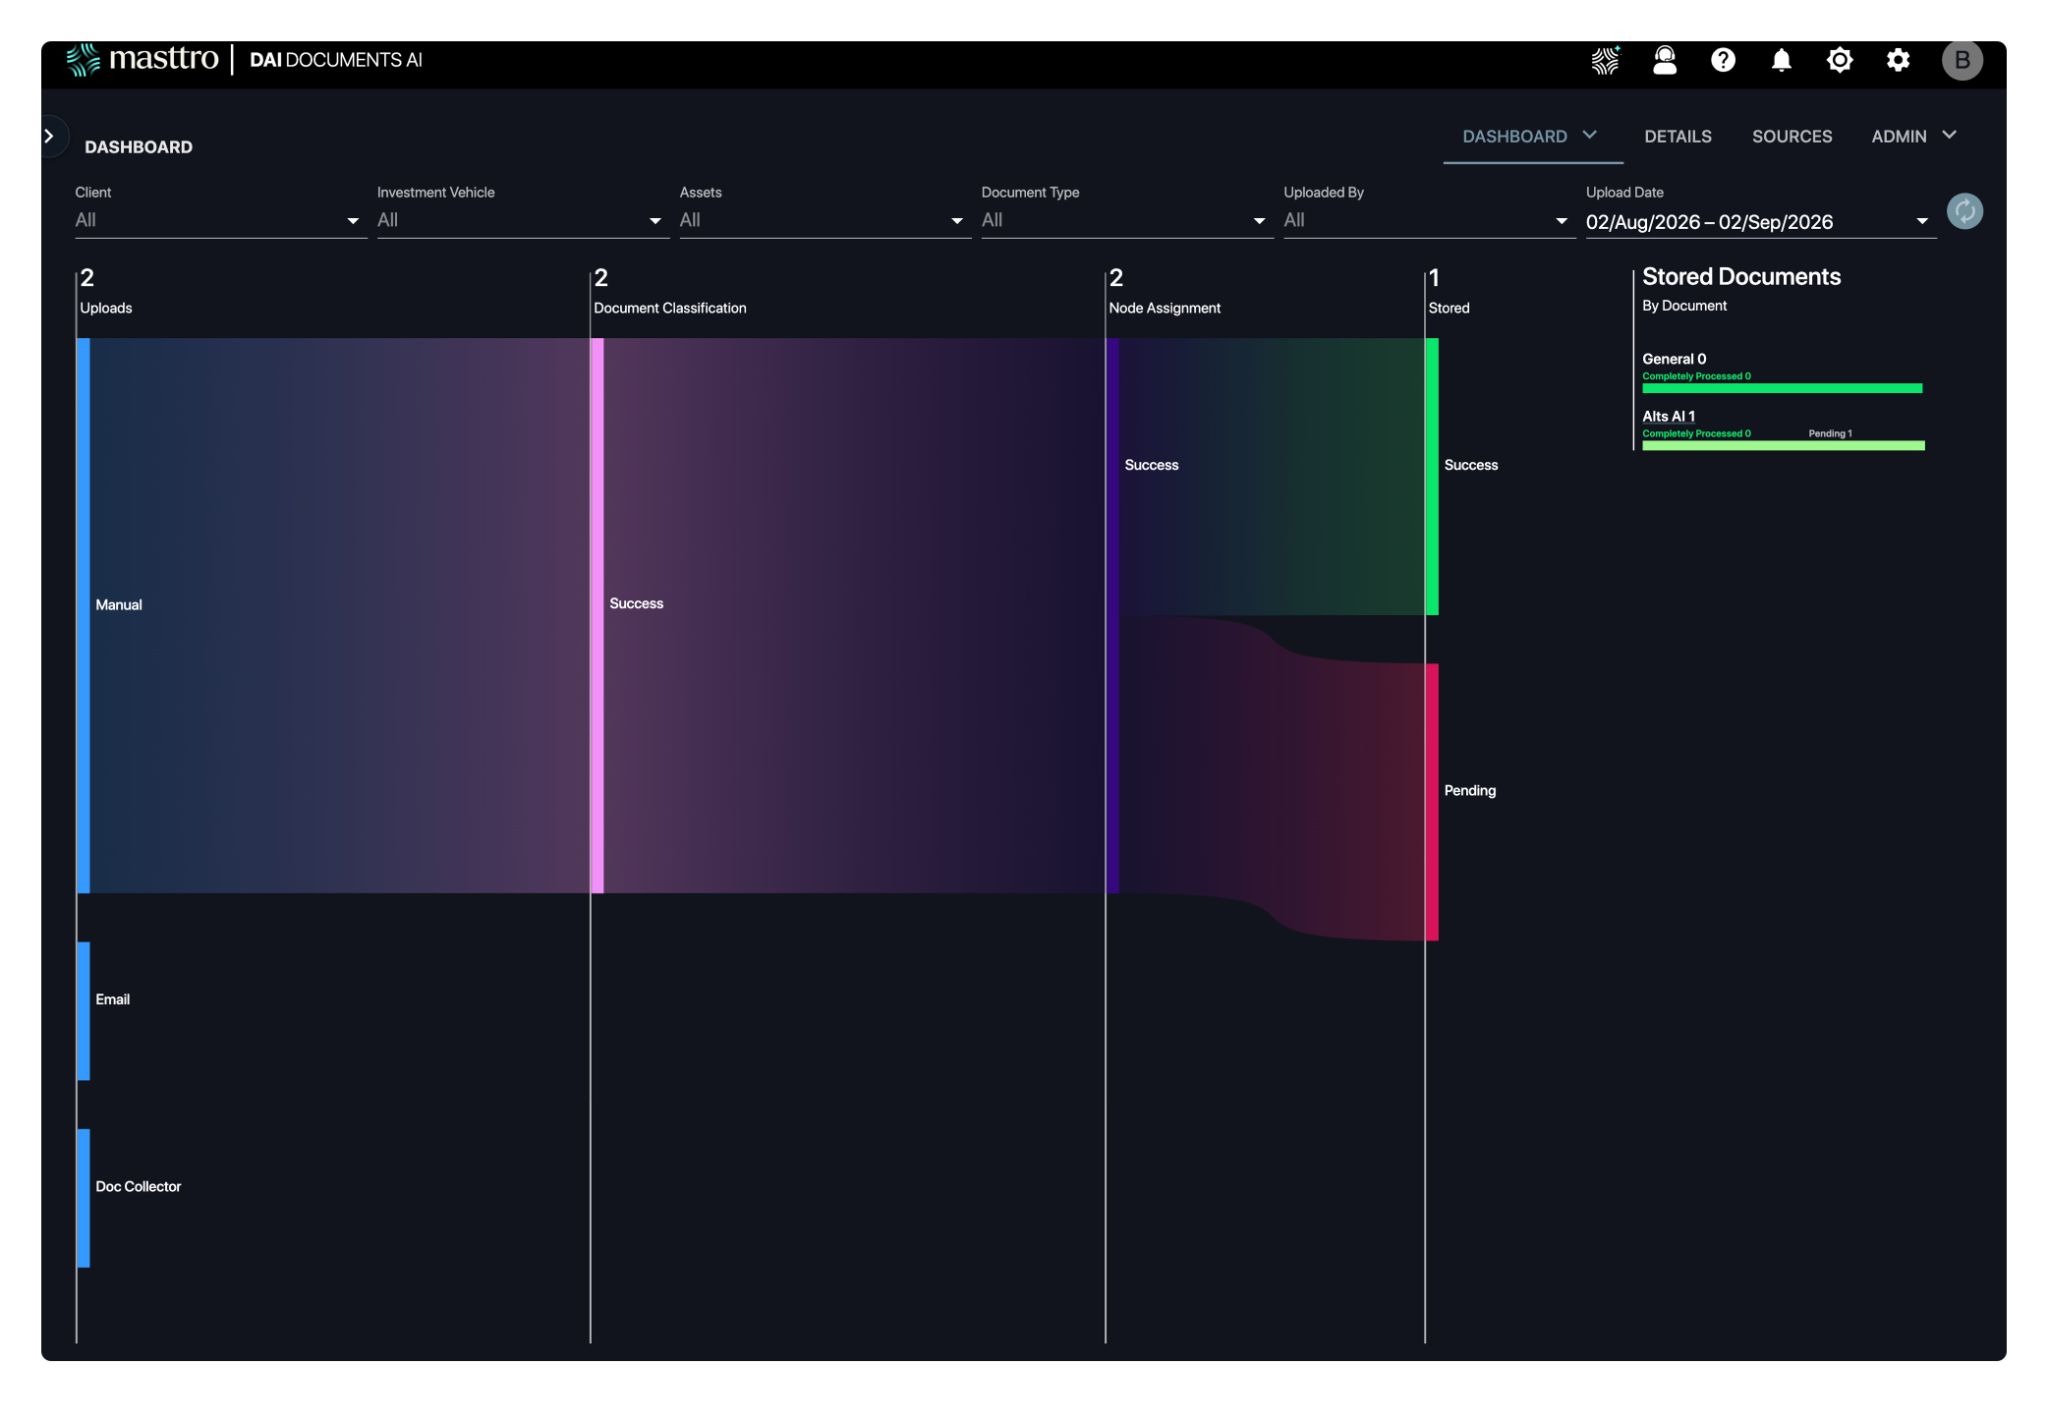
The view most family offices never build, and the one keeping every other view honest.
Why it matters
It answers a question asked implicitly before every meeting: are these numbers ready to use? A dashboard that always looks finished — even when three custodian feeds have not landed and two portfolio valuations are two quarters old — will be trusted right up until the first meeting where it is wrong. After that, nobody opens it. Data transparency is not a feature you add later; it is what makes the other nine dashboards usable.
Key elements
- Reconciliation processes tracked by custodian, bank and legal entity, with status visible.
- Missing statements, failed feeds and gaps in the transaction record.
- Stale price and stale valuation flags, with an age threshold set per asset type.
- Exceptions queue with a named owner for each item.
- A completeness percentage and a sign-off state for the current reporting period.
Questions it answers
- Are these numbers complete enough to present?
- What is missing, and who is chasing it?
- When was each data source last updated?
Where it breaks
Reconciliation status living in the accounting team’s notes rather than on the dashboard. If the completeness signal is not next to the number, it does not exist.
Real-time data processing across 7M+ daily transactions is what makes automated data reconciliation possible at this scale — manual checking does not survive the volume.
10. Document and tax readiness
Every number on every dashboard above traces back to a document. The tenth view tracks whether those documents arrived, were read, and were filed against the right holding.
Why it matters
Year-end tests a family office’s data discipline. Schedule K-1 forms that arrive late, NAV statements filed under inconsistent names, capital call notices sitting in an inbox — each is a small delay compounding into a painful close and an accountant’s list of questions in March.
Key elements
- Document status by holding: received, extracted, reconciled, outstanding.
- K-1 tracking by entity and by fund, with a year-end tax compliance readiness view.
- GP statements and capital account statements with their as-of dates.
- Extraction status — what the system read and what still needs a person.
- Search across private markets documents, tied to the holdings they belong to.
- Clean exports into tax software and to the family’s accountants.
Questions it answers
- Which K-1s are outstanding, and from whom?
- Are we ready for the filing deadline, entity by entity?
- Where is the statement behind this valuation?
Where it breaks
Manual collection. The repository becomes a filing cabinet nobody maintains, and the dashboard above it inherits the gaps.
Documents AI handles this through AI automation rather than automated optical character recognition software alone — OCR reads characters, but tagging a capital call to the right fund, entity and bank account is an interpretation problem. This is the practical difference between AI-native platforms and AI integration bolted onto a legacy software system, and it is why 34% of family offices had adopted AI tools by Simple’s 2025 report, roughly triple the prior year.
Expanding Family Office Capabilities

Who uses each dashboard?
A family office dashboard is not one screen for everyone. It is a shared set of definitions rendered at different depths for different people — which is also how you solve the collaboration challenges that surface when principals, staff and external advisors work from different exports of the same numbers.
The principal interface matters more than most vendors admit. A family member should be able to open a mobile app and answer their own question without routing it through the office, while the operations team works in a far denser view of the same data. Workflow collaboration between them happens through a secure communication portal rather than email attachments, and multi-family offices deliver the whole thing to households under their own brand through white-label reporting.
If you are building a first version, start with the wealth map, the portfolio overview, cash flow and alternatives — then add the reconciliation panel before anything else.
Where do family office dashboards break, and how do you prevent it?
Definitions drift
One month “cash” includes money market funds, the next it does not. Write the definitions down once, use them in every view, and treat a change as a policy decision rather than a preference.
Alternatives arrive late
Private funds are not daily priced. Show “as of” dates everywhere and make it normal to say the private sleeve is as of last quarter. Better still, automate ingestion so the lag is measured in days.
Spreadsheet glue becomes permanent
A workbook connecting two systems becomes the process. Cloning data out of the platform into a spreadsheet — or into Power BI for a chart the reporting layer should already produce — creates a second version of the truth that nobody reconciles. If a spreadsheet runs every month, it is a workflow that has not been built yet.
No reconciliation checks
If nobody confirms cash and transactions tie out, the dashboard is an estimate presented as a fact.
No owner and no sign-off
Data is always in motion, so someone has to say when it is ready. “The controller confirms the monthly pack is complete by day eight” is enough.
Security treated as a later problem
Wealth data is the most sensitive information a family holds, and security and compliance risks scale with every additional export, integration and inbox. Role-based access by entity, audit trails, and isolation keeping data out of third-party hands are dashboard requirements, not IT preferences.
Scalability considerations arrive late
A dashboard built for one entity and two custodians rarely survives the third jurisdiction. Ask what happens at ten entities, six currencies and 200 alternative positions before you commit.
How do you build a family office dashboard that stays accurate?
Step 1 — Write a one-page dashboard brief
Who it is for, which decisions it supports, what version one will not do, refresh cadence by asset type, and definitions for performance, cash and valuation date. If it does not fit on a page, the scope is not ready.
Step 2 — Map the data sources
Custodians, banks, GP statements, appraisals, entity accounting, and every manual input with a named owner. Then set refresh rules per source and label forecast items as forecast.
Step 3 — Fix the ownership map first
Entity structures and ownership percentages are the foundation of every consolidated number. Get this wrong and every rollup above it is wrong.
Step 4 — Automate the document layer
Capital calls, NAV statements and K-1s are the highest-volume manual work in a family office and the most common source of staleness. Automated processes here are what make the private sleeve current rather than quarterly.
Step 5 — Add controls and a sign-off
Reconciliation checks, missing-statement flags, stale-valuation flags, role-based access, an audit trail for overrides, and one review step before the meeting pack goes out.
Step 6 — Design the drill-down. Every top-line number should have a path: total wealth → entity → account → asset → transaction or valuation source. That is what turns a dashboard number into a number the team can defend.
Step 7 — Plan the exits before you sign
Ask how data leaves the platform: an open API into downstream analytics systems, scheduled exports into accounting and tax software, and a documented path for taking your history with you. A dashboard you cannot export from is a dependency, not an asset — and this is the question buyers most often skip until renewal.
Family office dashboard requirements checklist
Data coverage
- Supports every legal entity in the family structure without manual rollups
- Handles multiple custodians and banks through direct connections
- Covers public and private assets plus lifestyle assets in one reporting model
- Supports multi-currency accounts with clear base-currency reporting and FX attribution
- Maps ownership interests so assets are not double-counted
Alternatives handling
- Tracks commitments, called capital and unfunded commitments
- Tracks capital calls and distributions with full history
- Shows valuation date and valuation source on the view
- Extracts capital call notices, GP statements and K-1s automatically
- Makes stale valuations visible rather than hidden
Controls and reliability
- Data reconciliation status visible on the dashboard
- Missing feeds and missing statements flagged
- Exceptions have owners and a review process
- Overrides and classification changes tracked
- A defined sign-off moment for meeting readiness
Reporting and delivery
- Produces monthly and quarterly reports without rebuilding from scratch
- Customizable dashboards with different depths for principals, investment teams and advisors
- Drill-down for explanation and audit
- Secure delivery to family members on desktop and mobile
Security and access
- Role-based access by person and by entity
- Data isolation keeping client information out of third-party hands
- Audit trail for access and changes
- Clear onboarding and offboarding process
Commercial and implementation
- Pricing not tied to assets under management
- Open API and clean exports, so data is portable
- Clear scope for data migration and history
- A named owner for dashboard definitions and governance
Family office dashboard reference guide
Frequently asked questions
What is a family office dashboard?
A set of role-based views summarising what a family owns, how it is performing, what liquidity is available and whether the underlying data is complete — across custodians, legal entities, currencies and asset classes. It supports decision making rather than displaying charts.
What should a family office dashboard include?
At minimum: a wealth map showing entity structures and ownership, a portfolio overview, a cash flow and liquidity view, an alternatives and commitments view, and a reconciliation panel confirming the data is ready. Offices with lifestyle assets, multiple managers or cross-border holdings should add the remaining views above.
How often should a family office dashboard update?
Liquid holdings and cash can update daily through real-time data processing. Alternative assets update when documents and portfolio valuations arrive. What matters is that every figure carries an “as of” date, so nobody mistakes a quarterly valuation for a live one.
What is the hardest part of building one?
Private markets, entity complexity and definitions. If ownership mapping is not clean, consolidated numbers will be wrong. If performance and cash are not defined once and used consistently, every meeting relitigates the arithmetic.
How do we avoid a dashboard that looks good but is wrong?
Put reconciliation status on the dashboard, flag missing feeds and stale valuations, give every headline number a drill-down path to its source, and name an owner and a sign-off moment per reporting period.
Can family members access the dashboard directly?
They should. Digital portals and a mobile principal interface let family members answer their own questions without routing every request through the office. Stonebridge Family Office cites self-service login as one of the platform’s largest gains.
Do we need dedicated software, or can we build dashboards on our accounting system?
Family Office Accounting packages are built for the ledger, not for wealth consolidation across entities, currencies and alternatives. Most offices run investment portfolio management software as the front end and bridge it to accounting — Masttro’s Investment Sub-Ledger exports to an existing general ledger rather than replacing it.
How long does it take to stand up?
It depends on the complexity of the structure and the volume of alternative assets. Jefferson River Capital, with a $1B+ portfolio and more than 200 alternative investments, was live in three months or less.
Delivering the information wealth owners expect
Wealth owners expect immediate answers, the same way they expect to track anything else in real time. On-demand dashboards are no longer a differentiator for family offices and wealth managers. They are the baseline, and the differentiator has moved to whether the data underneath them is complete.
That is the thread running through all ten views. The first eight tell a family what it owns and how it is doing. The last two make the first eight worth reading.
Masttro consolidates multi-custodial data from 700+ custodian connections across 40+ countries into one live view spanning every asset class, entity and generation, and automates the operational work behind it — capital calls, GP statements and Schedule K-1 forms — with native AI. More than 400 family offices run on it, at pricing that is not tied to assets under management.
Ready to see these dashboards against your own entity structures? Book a demo, or start with the guide Five Dashboards Every Wealth Owner Needs.